4 Typology Construction
4.1 Introduction
With Typology Construction we wanted to answer a few questions in the continuity of our main question for the MCDA analysis: How can urban streams be restored and integrated in Dresden’s fabric, such that there is a synergy between human activities and the natural environment?
In this case, the three questions that we tried to answer were:
- What are the streams’ adaptability rates to heat waves?
- How are the accessibility and connectivity conditions of green-blue areas?
- What are the areas of intervention along the streams?
To answer these questions, we picked some of the attributes that we computed for the MCDA analysis. We tried to select those that were the most relevant for the three questions, which are:
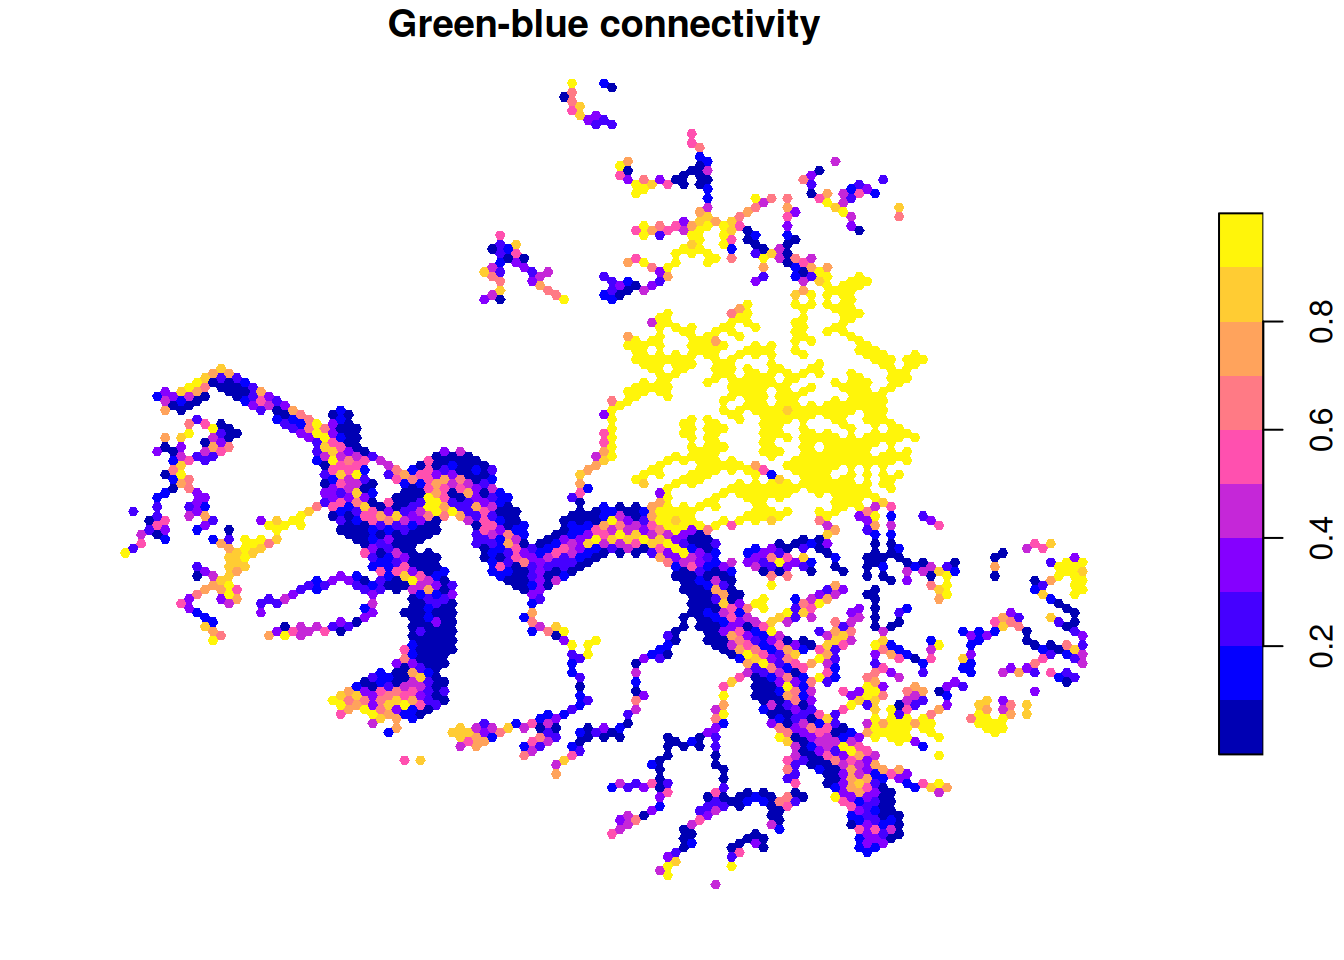
- Green-blue connectivity
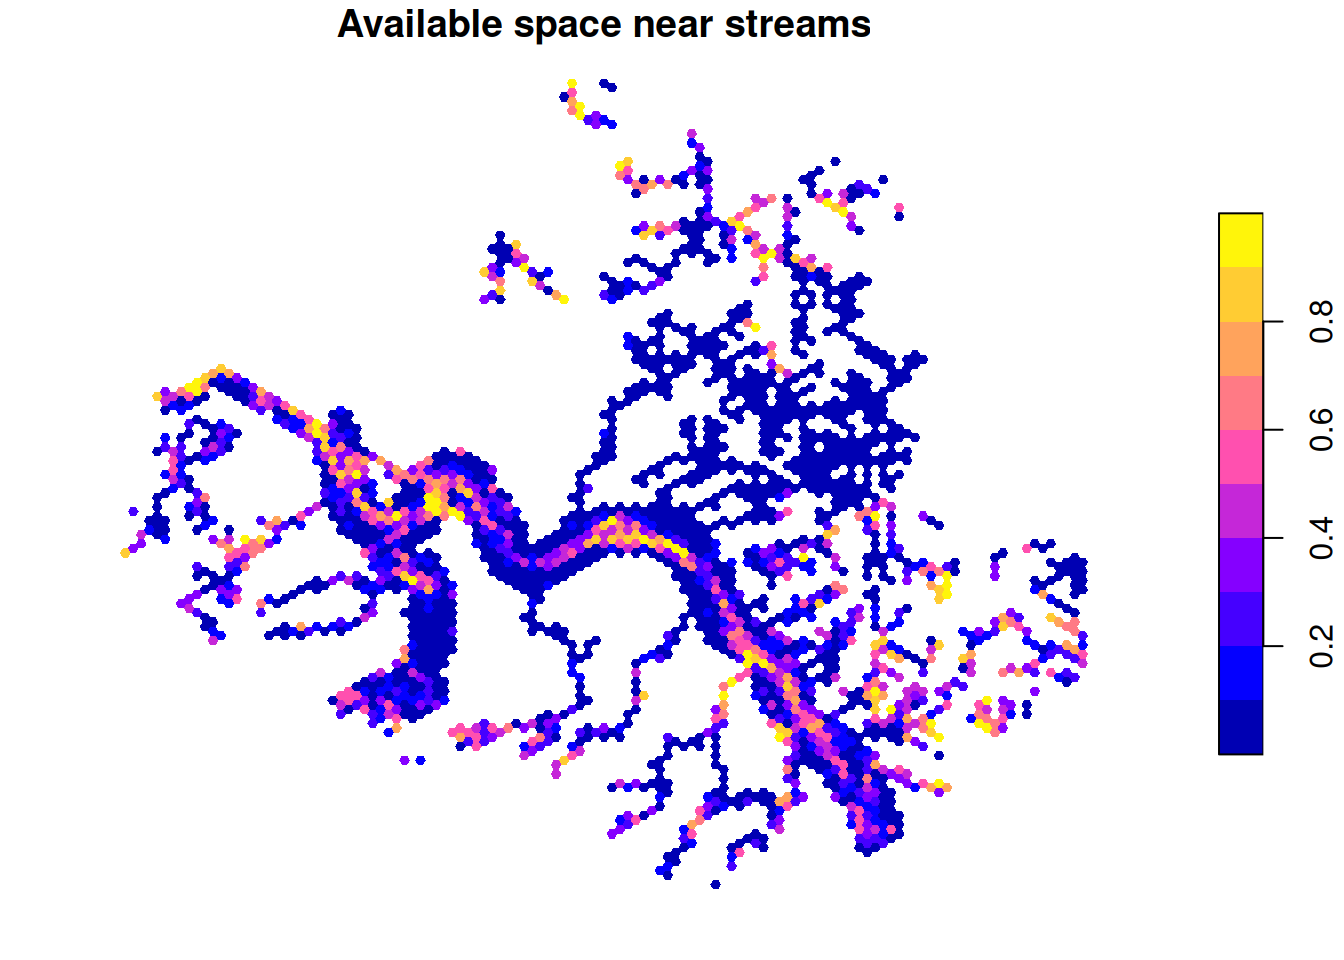
- Available space near streams
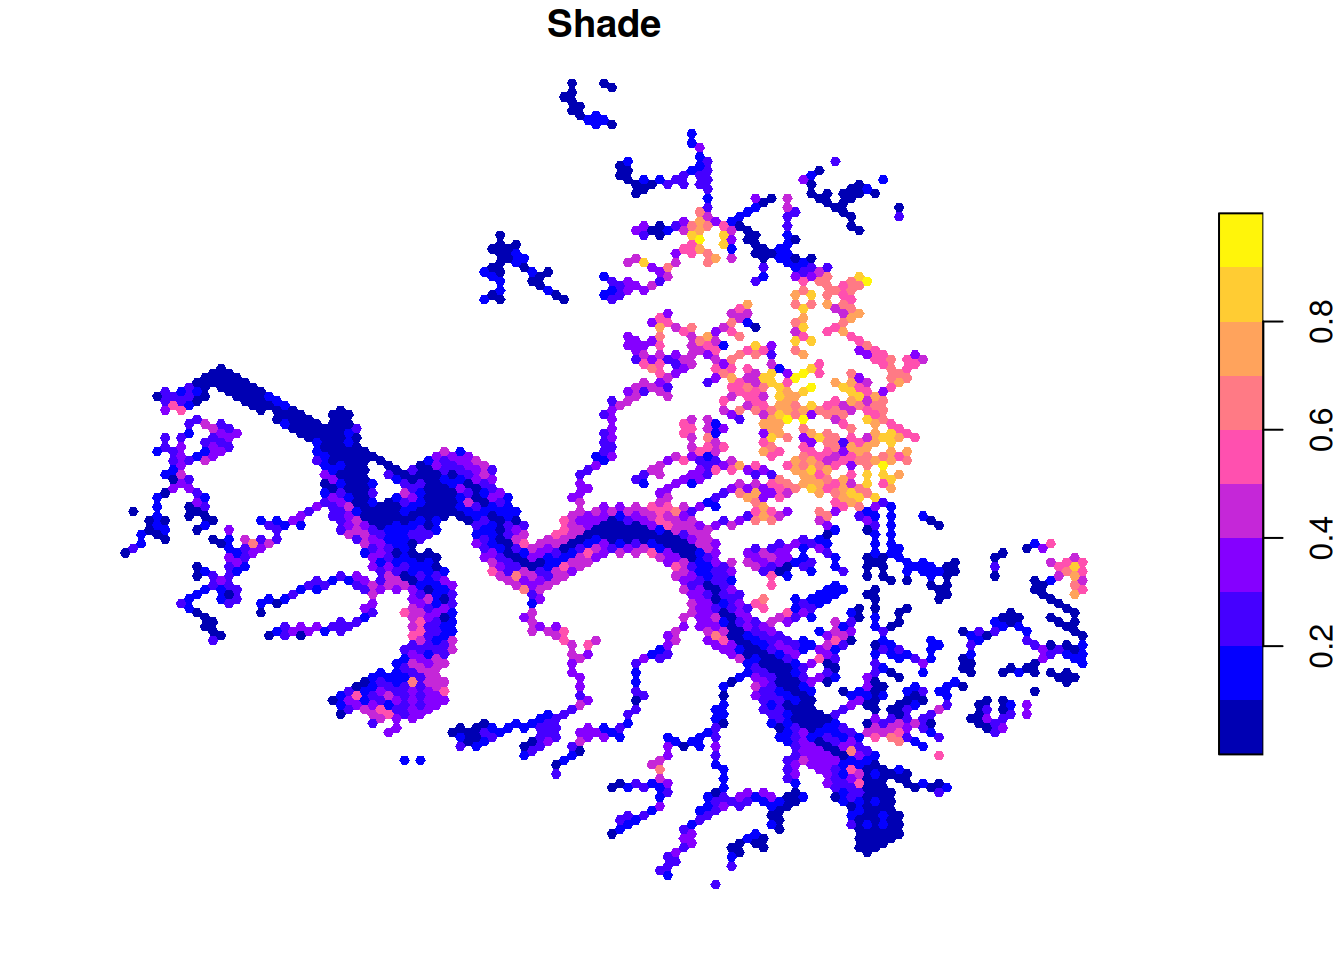
- Shade
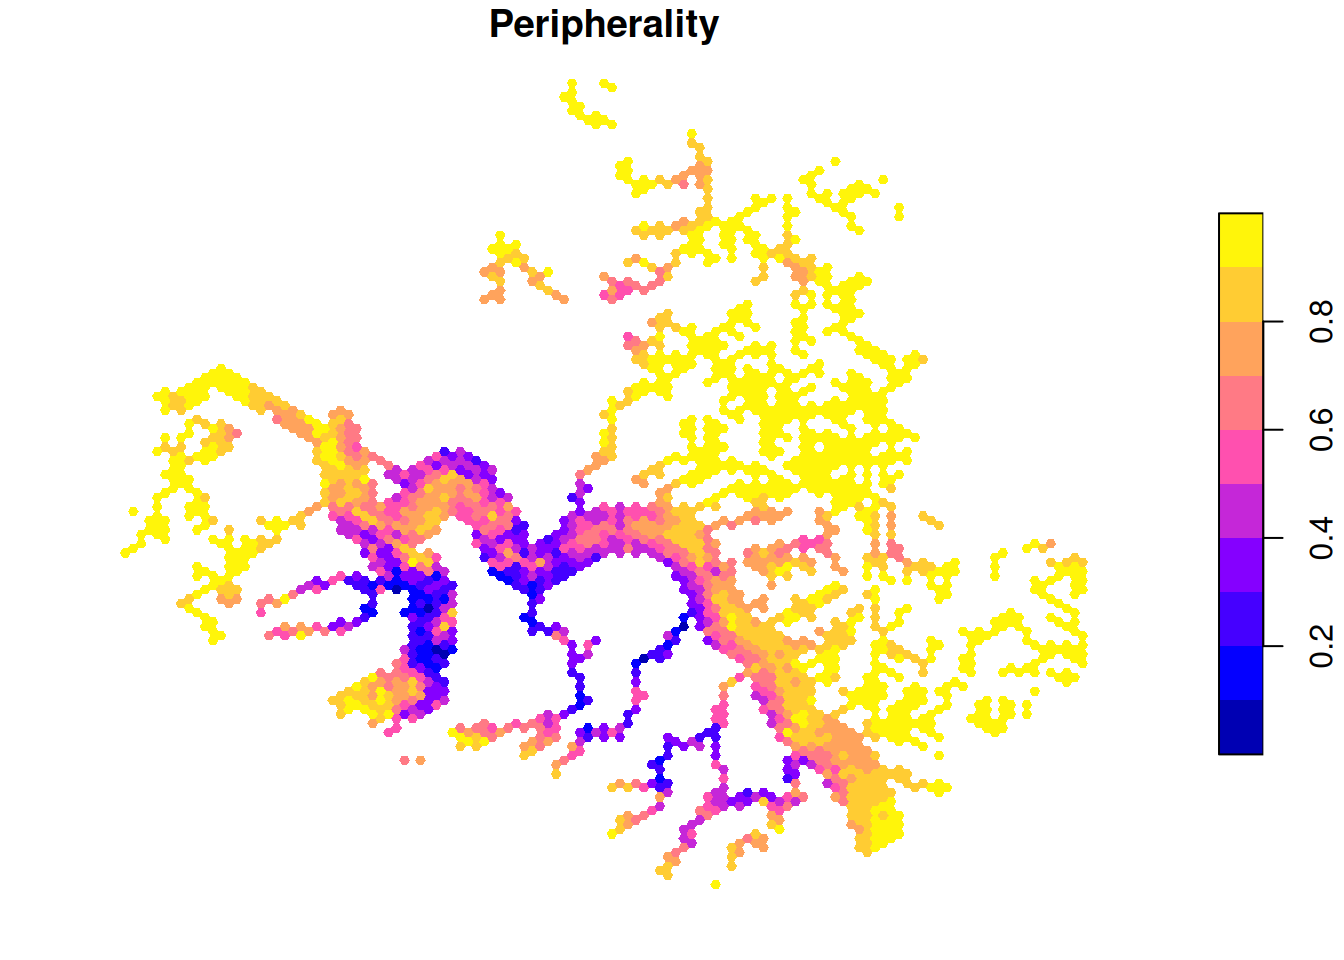
- Peripherality
Below are what these layers look like:
4.2 Clusters Computation
To begin the clustering, we started by normalising each feature to have an average of 0 and a standard deviation of 1.
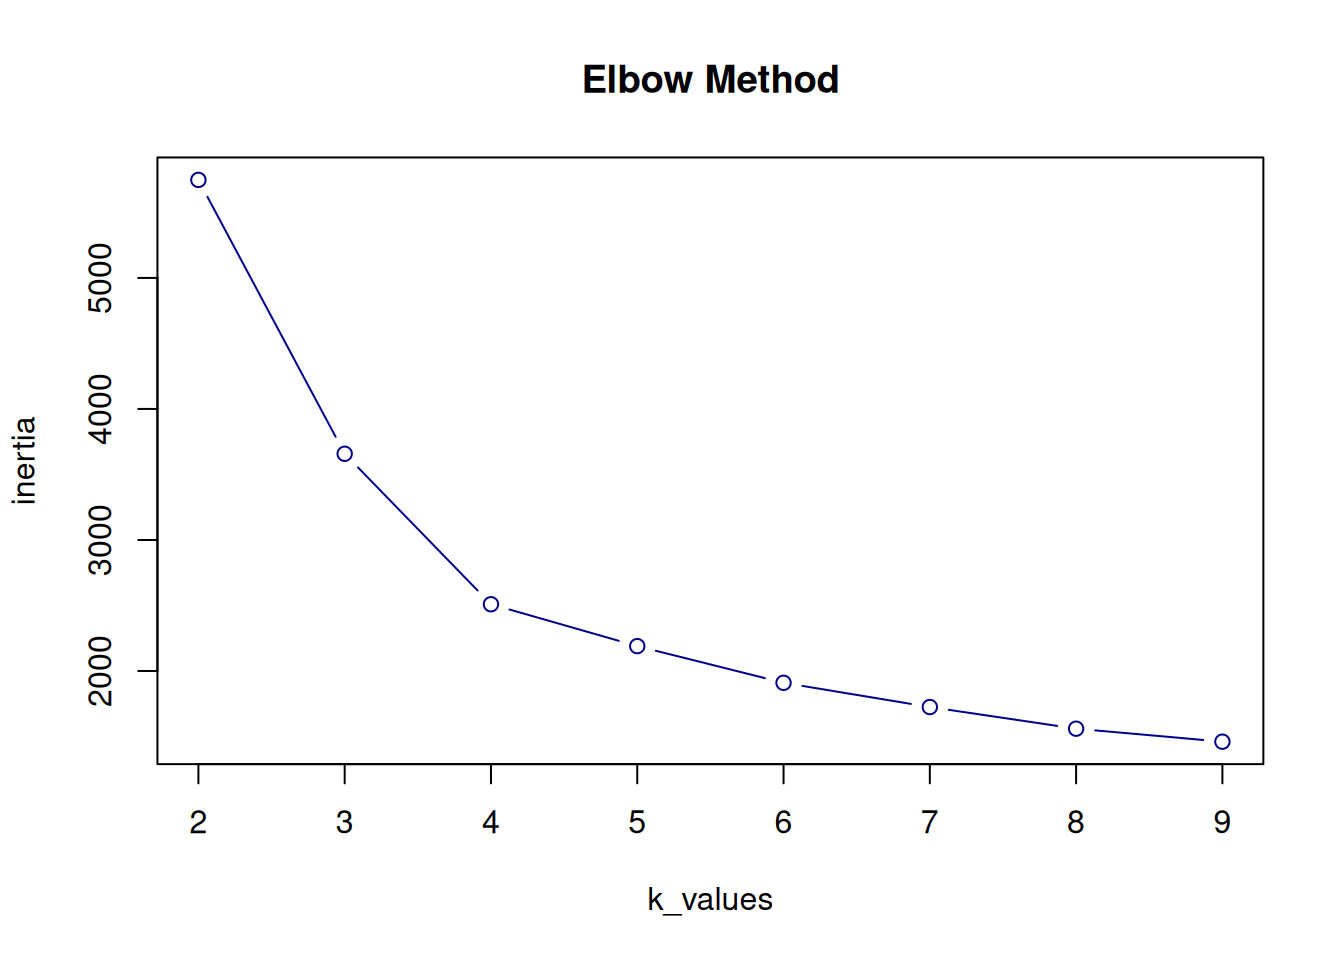
To use k-means properly to cluster the data, we had to select a good number of clusters. To do so, we used the elbow method. We tried values of \(k\) from 2 to 9, and looking at the graph of the inertia for all values in Figure 4.1, we picked \(k=4\) at the value with the largest elbow angle.
Then, we ran the k-means algorithm and to assign a final cluster to each spatial unit.
  1   2   3   4
577 730 486 432
We can see with Table 4.1 that each cluster contains a decent number of points. Then, we plotted the clusters geographically in the spatial units in Figure 4.2.
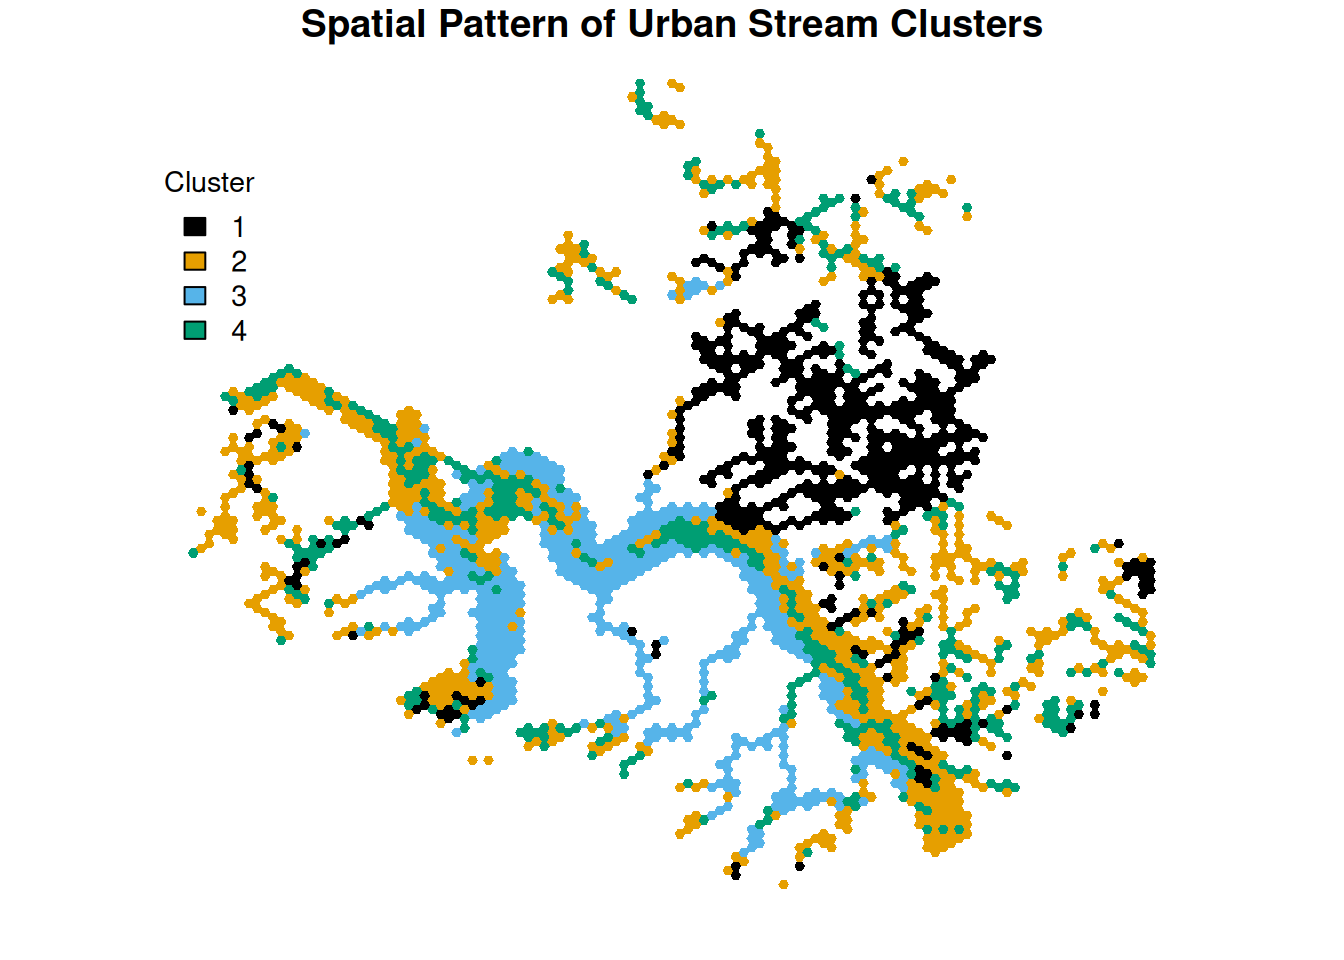
| Cluster | Green-blue connectivity | Available space near streams | Shade | Peripherality |
|---|---|---|---|---|
| 1 | 0.952 | 0.024 | 0.539 | 0.923 |
| 2 | 0.259 | 0.169 | 0.147 | 0.836 |
| 3 | 0.156 | 0.085 | 0.318 | 0.401 |
| 4 | 0.692 | 0.654 | 0.121 | 0.814 |
4.3 Topology Creation
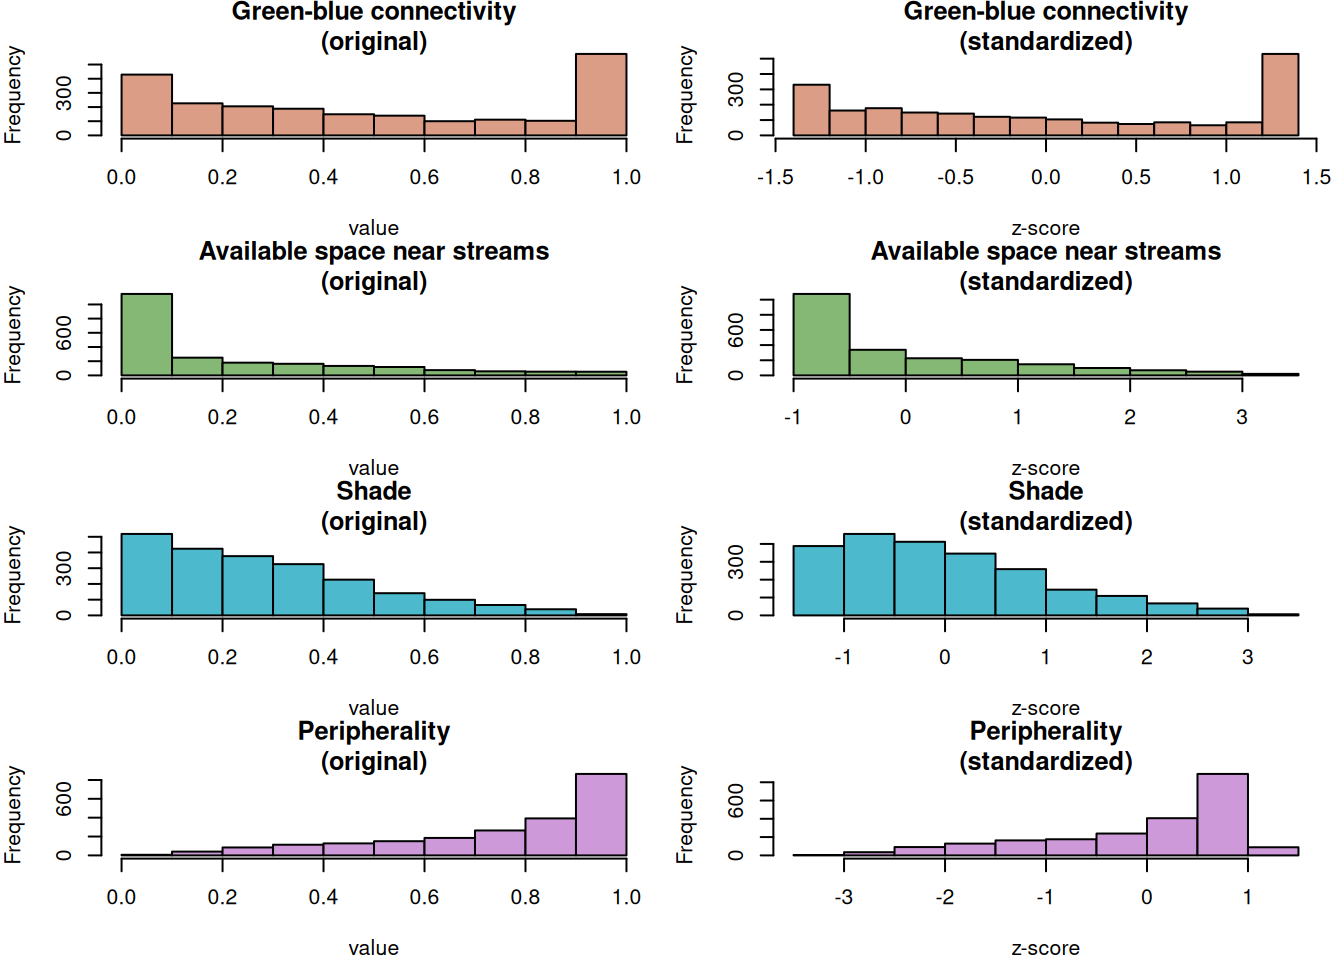
Before interpreting the results, an interesting point about this clustering is that all the variables we used have very different distributions, as can be seen from Figure 4.3. The fact that some of them have a high concentration of values on the extreme values makes it quite likely to have a cluster to be centred on this value for this attribute, and this is indeed what we can see in the output.
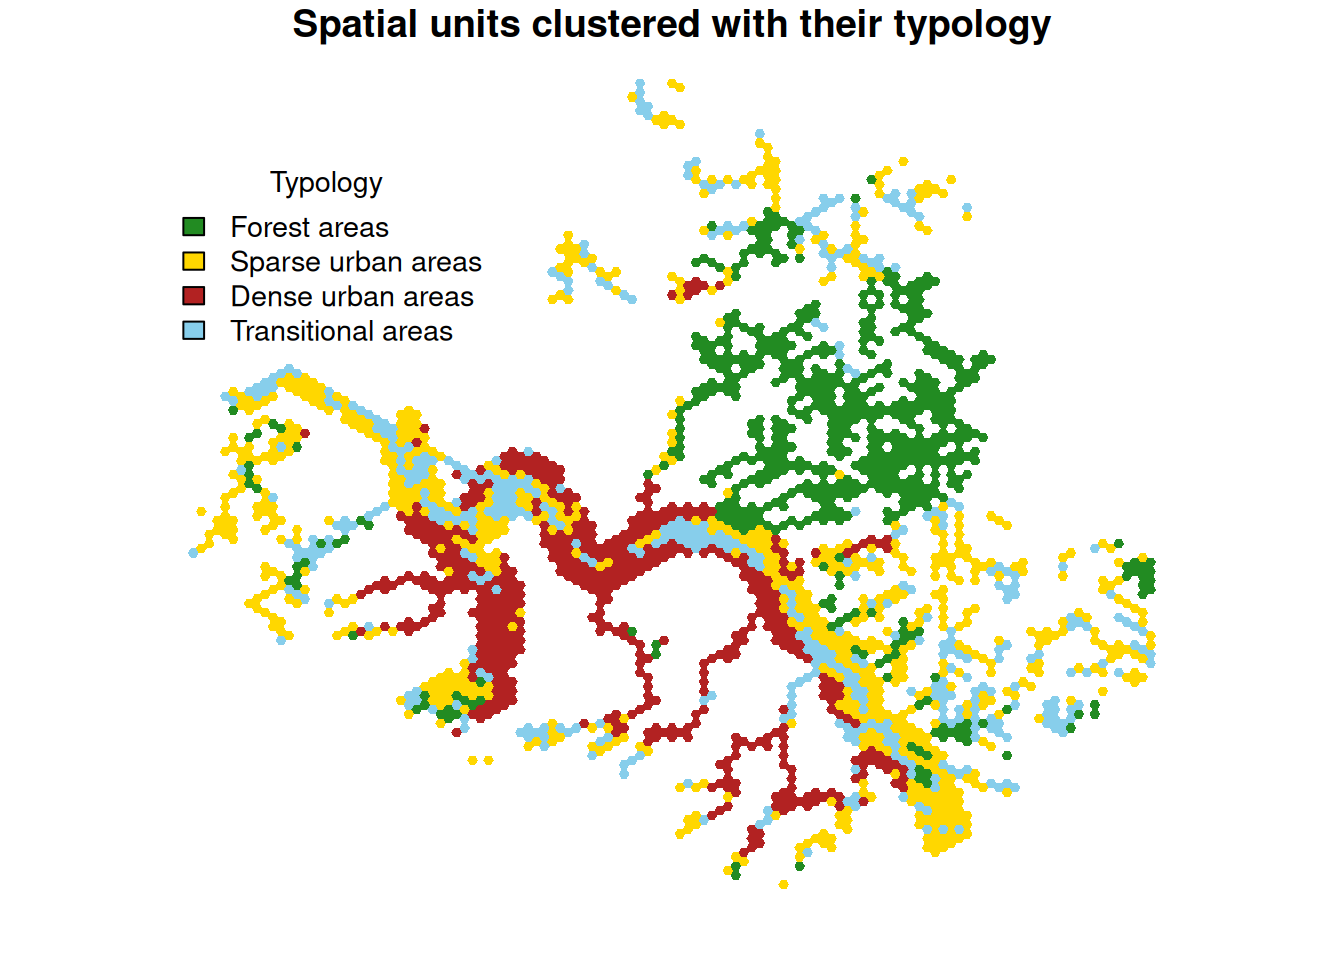
To interpret the clustering results, we examine the centers of each cluster in the original data scale. By observing the values and the geographic position of the spatial units in each cluster, we assigned the following typology to the clusters:
- Forest areas (Cluster 1):
- High proportion of greenery and shade due to the trees
- High peripherality because most of the forest is quite far from the houses
- Not much space available as the forest takes most of the space
- Sparse urban areas (Cluster 2):
- Some greenery and some available space because the housing is not too dense
- Quite high peripherality since there is housing, but a low population density
- Low shade because some sparse trees and low buildings are the only sources of shade
- Dense urban areas (Cluster 3):
- Very low amount of greenery and available space because space is mostly occupied by buildings
- Decent amount of shading because of the high and dense buildings
- Low peripherality as the population density is high in the area around
- Transitional areas (Cluster 4):
- Quite high proportion of greenery composed of mostly grass fields and some forest
- A lot of space available as the grass fields are often not really used
- Very low shade as only a few trees create shade
- Quite high peripherality since these places are not central and not well accessible
4.4 Answers to the Questions
Regarding the suitability of the spaces to sustain heat waves, the results are similar to what we could have expected, given that we mostly look at two attributes for this: the greenery and the shade. The forest areas are the most adapted with high greenery and shade that prevent the temperature from drastically increasing during heat waves. Transitional areas will not suffer too much from the the heat island effect thanks to a large proportion of greenery, but they also do not provide much shade to protect from the sun. The sparse urban areas are even worse because there is even less greenery and not much more shade, while the dense urban areas have at least some shade even if the heat island effect will be strong due to the soil artificialisation.
However, the best areas (forests) are also the most peripherical, so the less accessible, while the most accessible (dense urban) are the worst in terms of green-blue space accessibility. It could therefore be interesting to analyse which if the dense urban areas have access in a close proximity to forest or transitional areas, that could be used during these events.
Finally, the available space gives us information about the potential for simple interventions in each area. Transitional areas have the highest potential, meaning that they could be adapted to provide shelters in case of heat waves, for example by planting new trees. Sparse urban areas also have some potential while the dense areas already have most of their space used and forest areas should rather be kept as they are.