Analyzing Building Functions by Neighborhood
Duration: 45-60 minutes
Learning Goals
By the end of this tutorial, you will be able to:
- Classify buildings by function type (single vs. multi-functional)
- Use Field Calculator to create conditional classifications
- Perform spatial selection based on location (within/intersect)
- Execute spatial joins to append neighborhood attributes
- Calculate geometric attributes (area)
- Generate statistics by category (count and sum)
- Export and visualize aggregated data
Software and Data Required
Software: - QGIS (version 3.x or higher) - Web browser with internet access - RAWGraphs 2.0: https://app.rawgraphs.io/
Data files: - buildings.gpkg - Rotterdam building footprints with function data - buurten.gpkg - Rotterdam neighborhoods (buurten) ————————————————————————
Part 1: Preparing Building Function Data
Step 1.1: Load and Explore Your Data
- Start QGIS and create a new project
- Set the CRS to EPSG:28992 (Amersfoort / RD New - Dutch national grid)
- Load the layers:
- Add
buildings.gpkgstored in thepart3_data/vectorfolder - Add
buurten.gpkg(You have created this file in the first exercise - using data source manager))
- Add
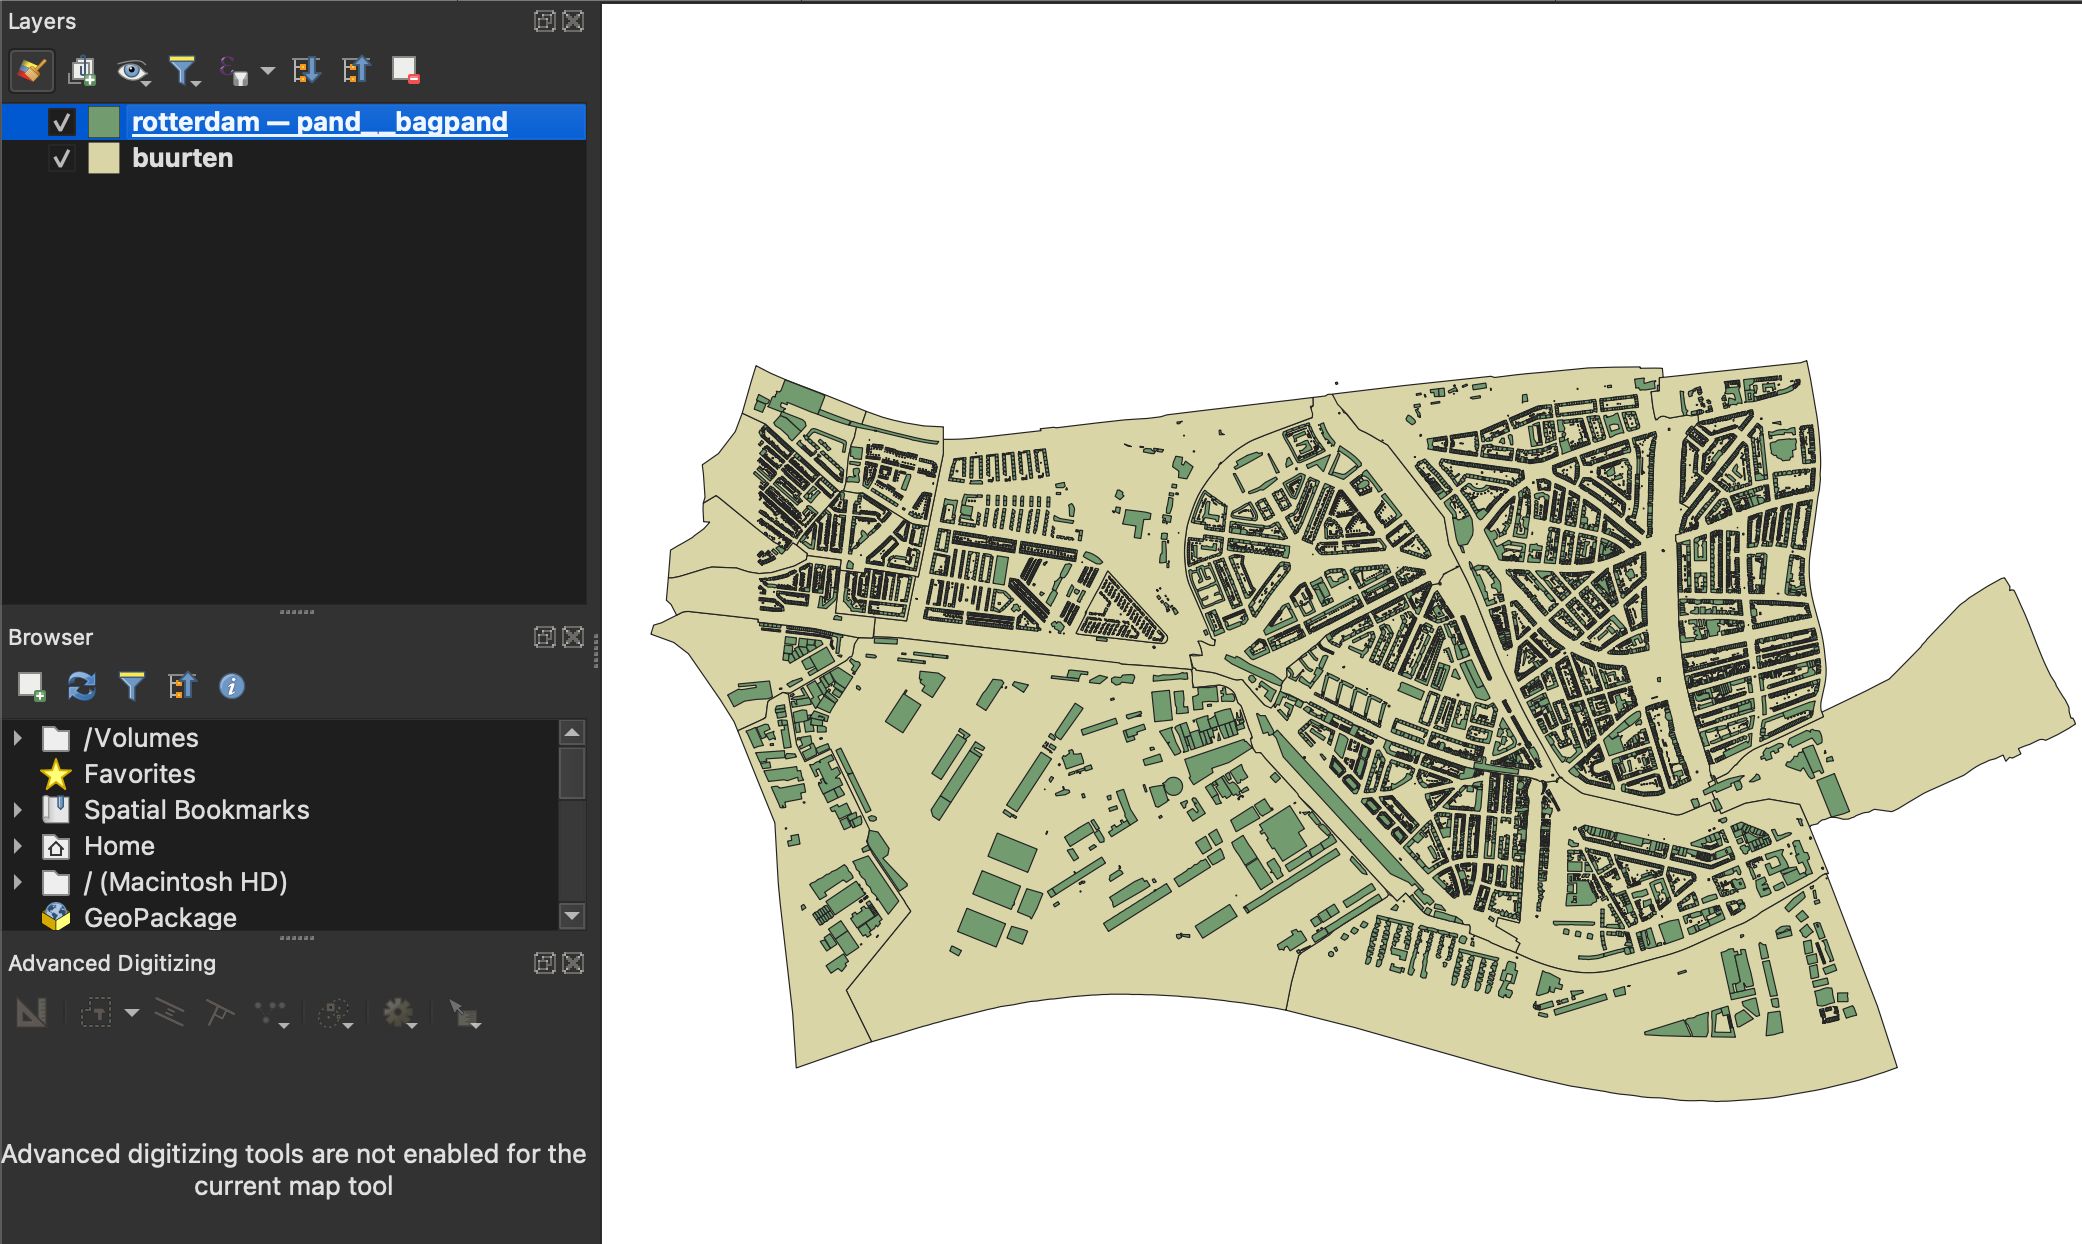
- Explore the building attribute table:
- Right-click
buildingslayer → Open Attribute Table - Identify the column containing building functions (e.g.,
functie,function, orgebruiksdoel) - Notice how functions are stored:
- Single function:
"woonfunctie"(residential) - Multiple functions:
"woonfunctie, winkelfunctie"(residential, retail)
- Single function:
- Right-click

Step 1.2: Classify Buildings by Function Type
We’ll create a new field that identifies whether a building has a single function or multiple functions.
Open the attribute table of the
buildingslayerEnable editing mode (click the pencil icon or press
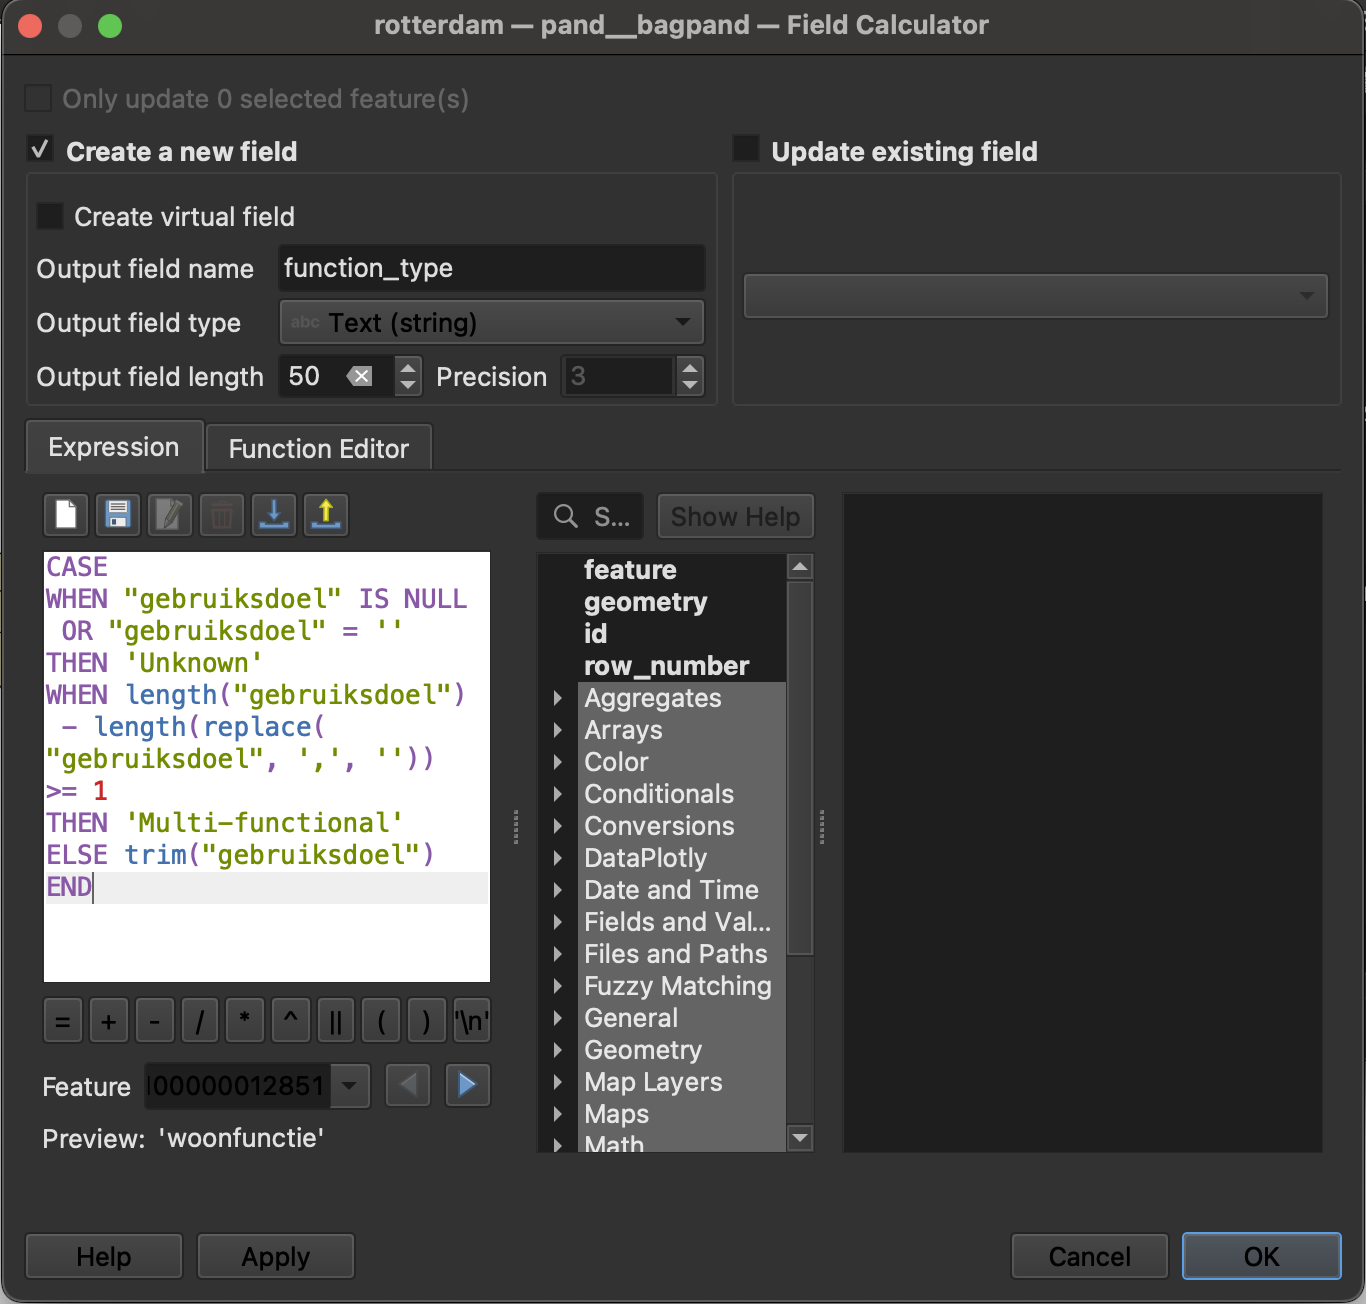
Ctrl+E)Open Field Calculator (click the abacus icon or press
Ctrl+I)Configure the new field:
- ☑ Check Create a new field
- Output field name:
function_type - Output field type:
Text (string) - Length:
50
Enter this expression:
CASE
    WHEN "function_column" IS NULL OR "function_column" = '' THEN 'Unknown'
    WHEN length("function_column") - length(replace("function_column", ',', '')) >= 1
        THEN 'Multi-functional'
    ELSE trim("function_column")
END
⚠️ Important: Replace "function_column" with your actual field name (e.g., "functie" or "gebruiksdoel")
What this does: - Counts commas to detect multiple functions - If 1 or more commas found → labels as “Multi-functional” - If no commas → uses the single function name - Handles null/empty values → labels as “Unknown”
Click OK
Save edits (click the save icon)
Toggle off editing mode (click the pencil icon again)
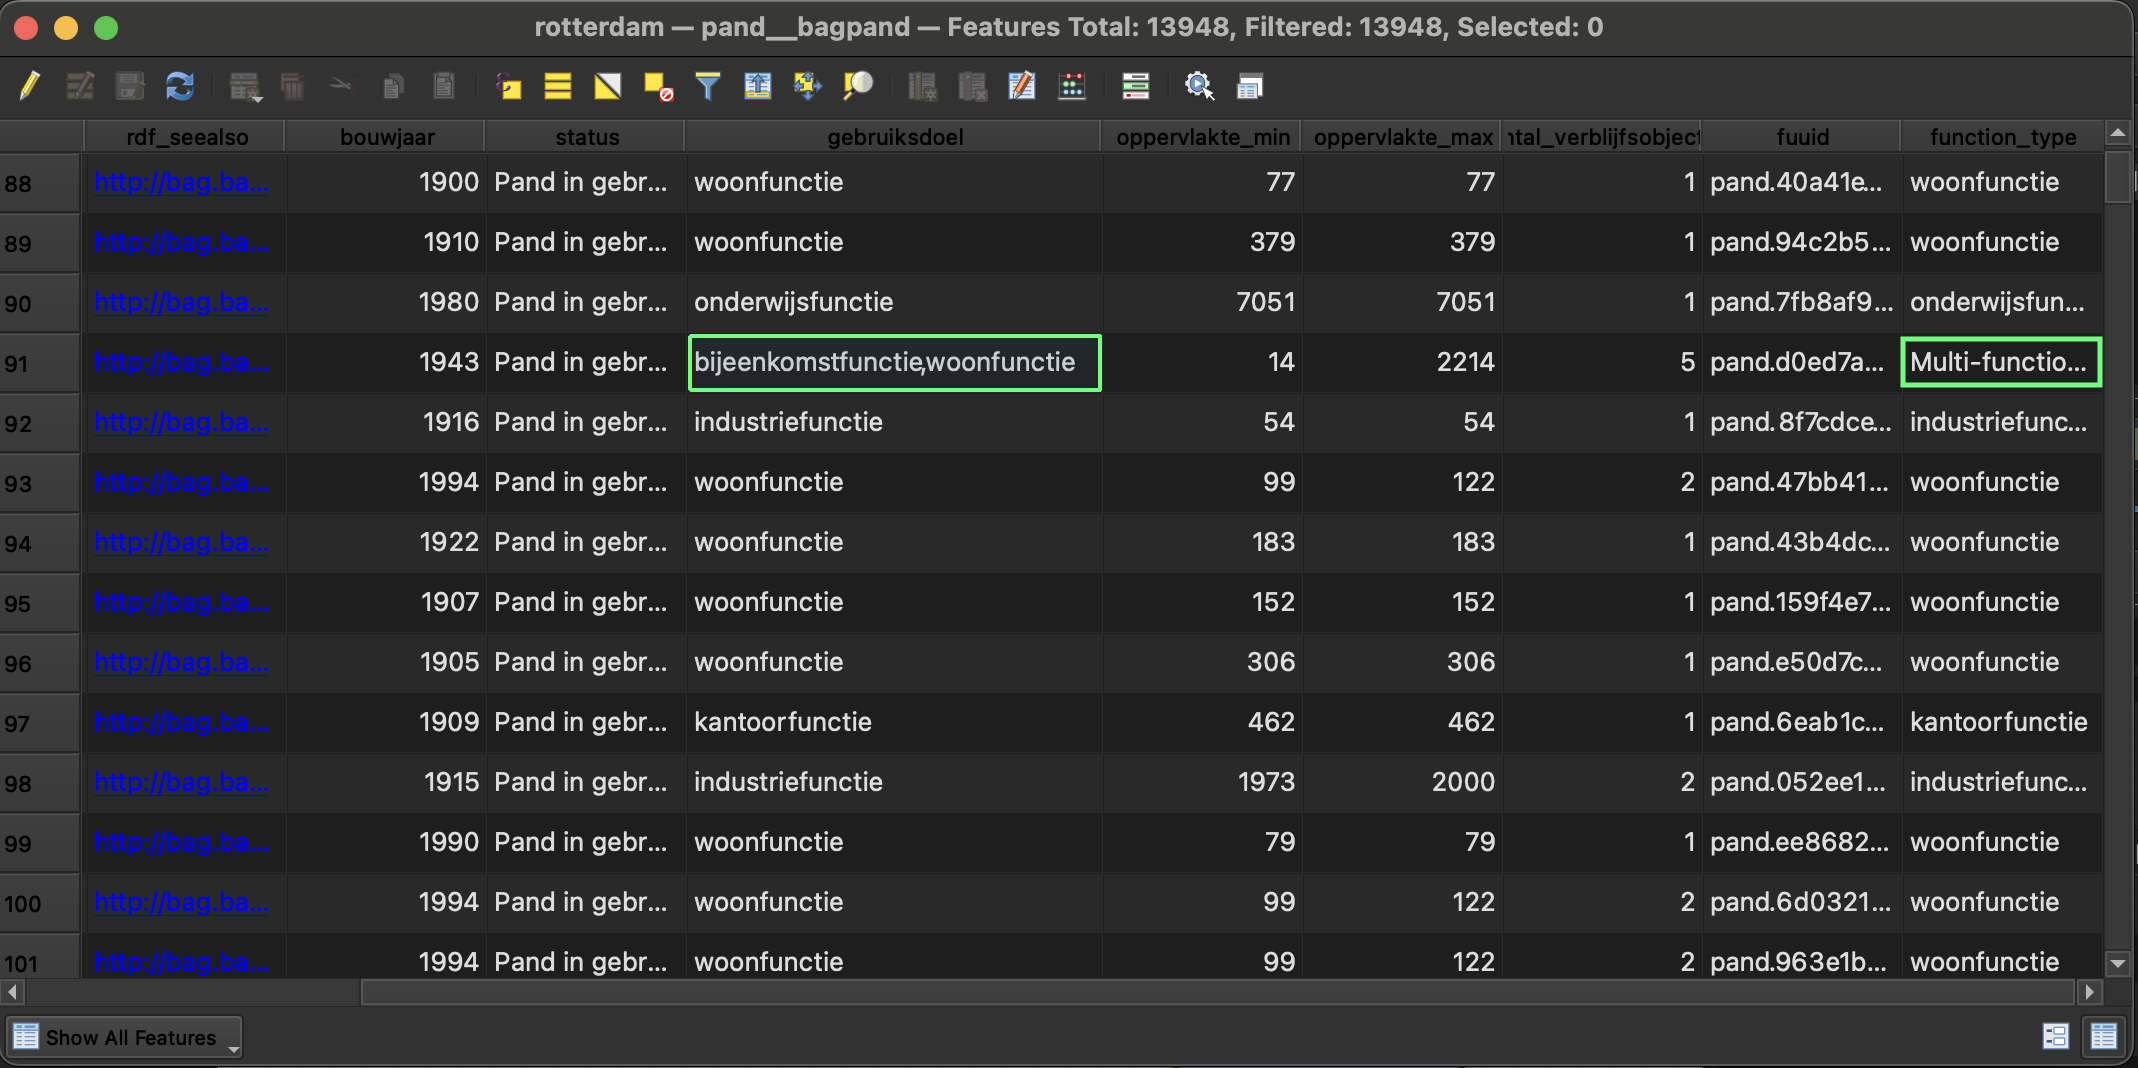
Verify your results:
Scroll through the attribute table
Check that buildings with multiple functions are labeled “Multi-functional”
Check that single-function buildings show their specific function name
Part 2: Spatial Selection and Join
Step 2.1: Select Buildings Within Neighborhoods
We need to identify which buildings fall within neighborhood boundaries.
Go to:
Vector→Research Tools→Select by LocationConfigure the selection:
- Select features from:
buildings - Where the features:
are within(orintersectif you want to include partially overlapping buildings) - By comparing to features from:
buurten - Modify current selection by:
creating new selection
- Select features from:
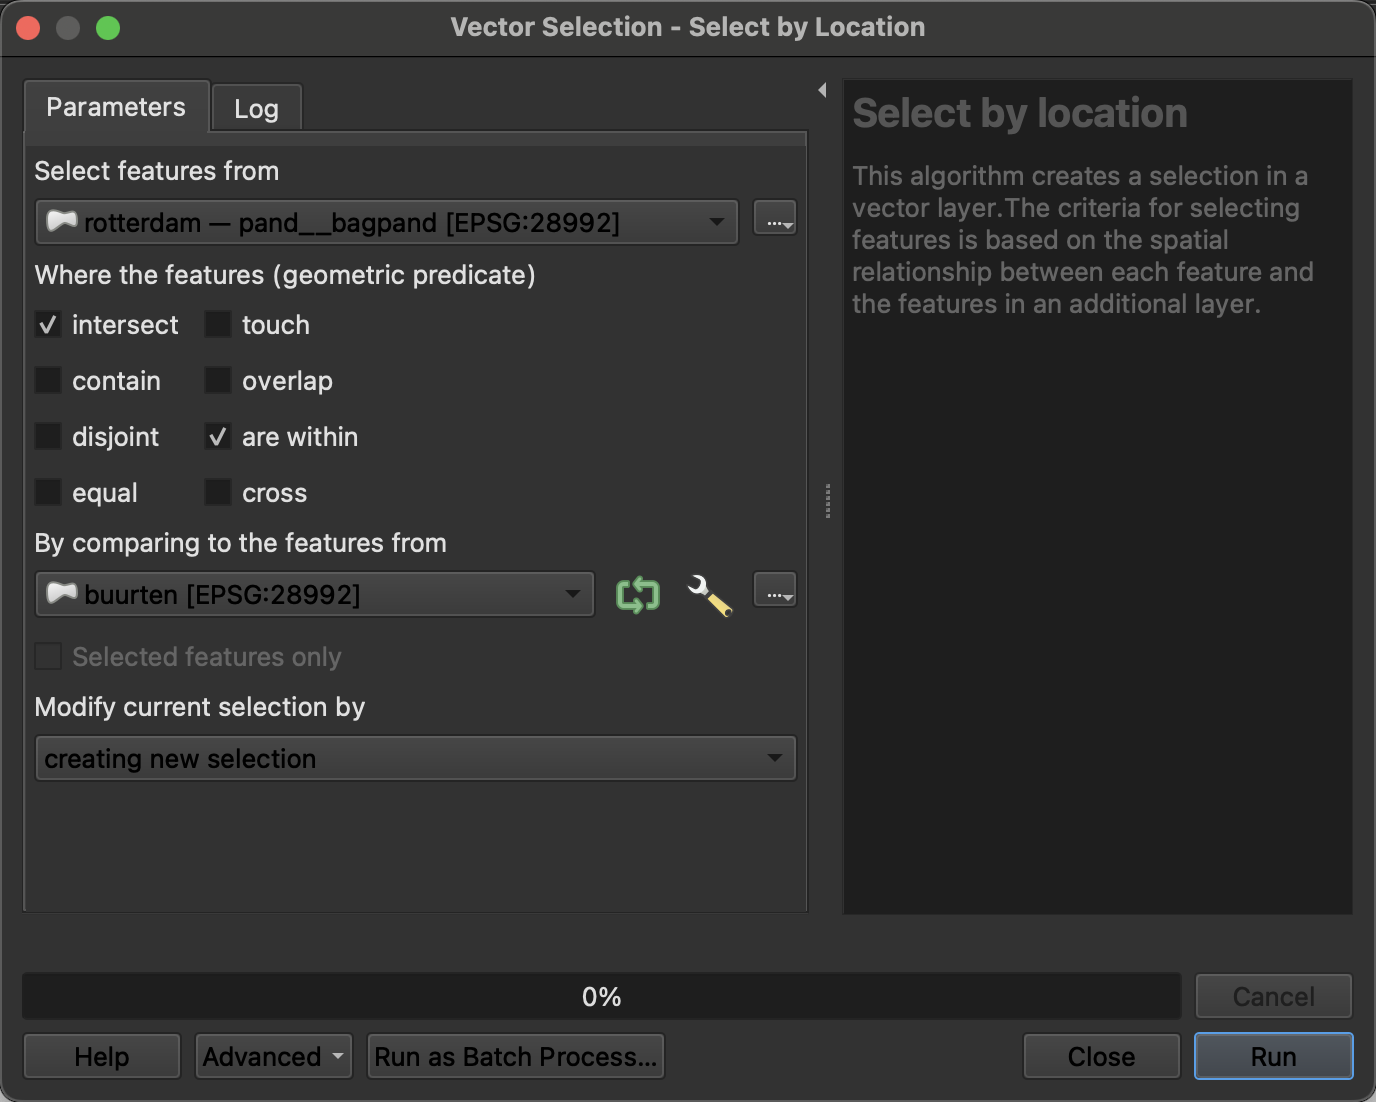
- Are within: Only buildings completely inside neighborhood boundaries (recommended for accuracy) - Intersect: Buildings that touch or overlap boundaries (may include buildings on borders)
Click Run
Check your selection:
- Look at the status bar: it shows “X features selected”
- Selected buildings are highlighted in yellow on the map
- In the attribute table, selected rows are highlighted
💡 Tip: If you want to keep only buildings within neighborhoods, you can export the selection as a new layer: Right-click buildings → Export → Save Selected Features As...
Step 2.2: Spatial Join - Append Neighborhood Names
Now we’ll add the neighborhood name to each building record.
Go to:
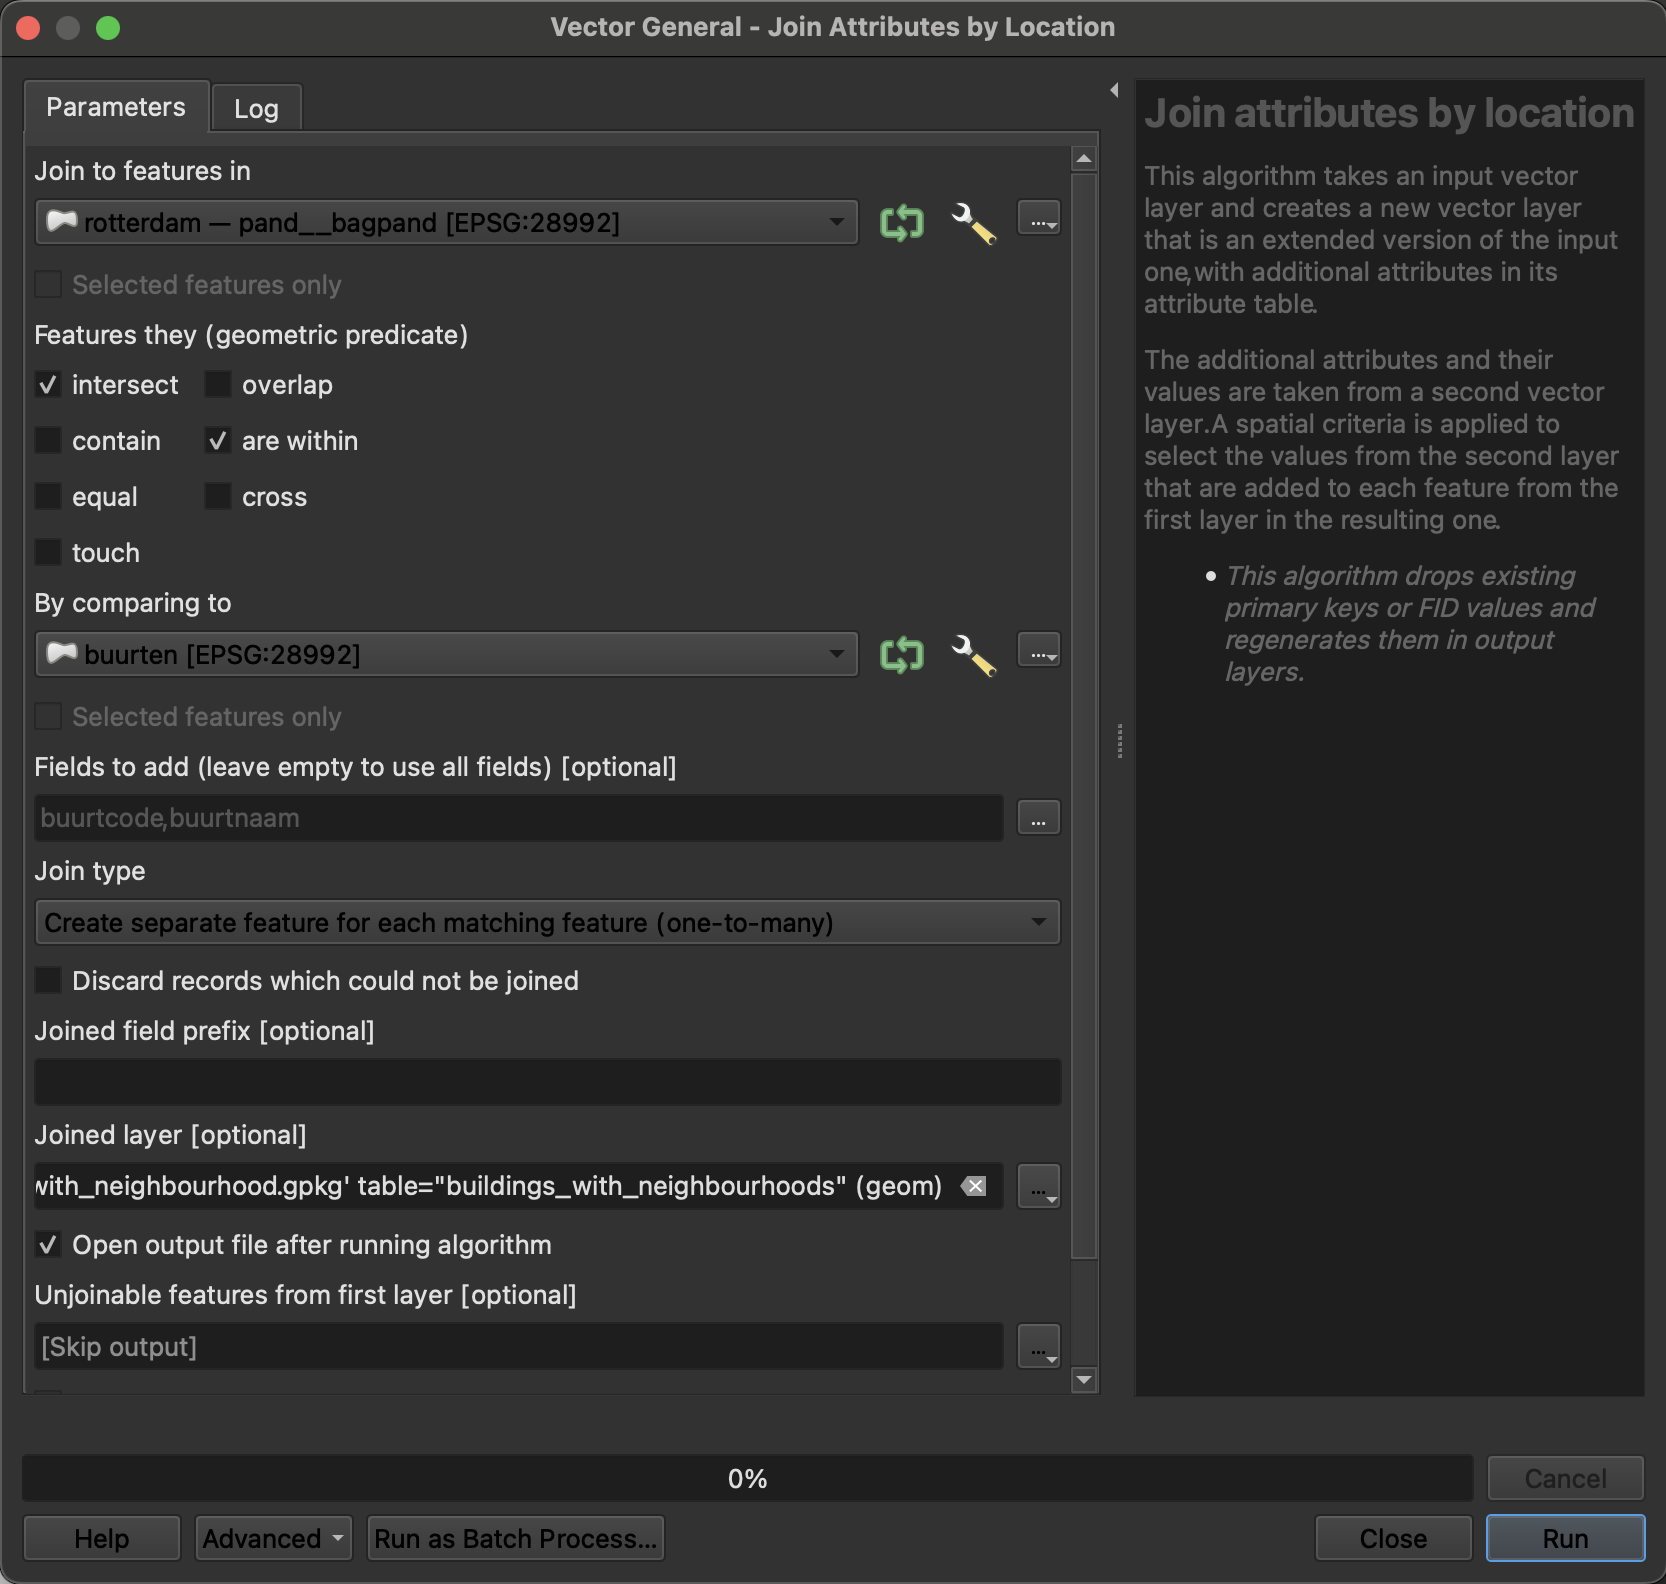
Vector→Data Management Tools→Join Attributes by LocationConfigure the spatial join:
- Input layer:
buildings(or your selected buildings if exported) - Join layer:
buurten - Geometric predicate: ☑
within(orintersects) - Fields to add: Click the
...button- ☑ Select only the neighborhood name field (e.g.,
buurt_naam,BU_NAAM) - ☑ You may also want neighborhood code (e.g.,
BU_CODE) - Uncheck other fields to keep the data clean
- ☑ Select only the neighborhood name field (e.g.,
- Join type:
Create separate feature for each matching feature (one-to-many) - Joined layer: Save as
buildings_with_neighborhoods.gpkg
- Input layer:
Click Run
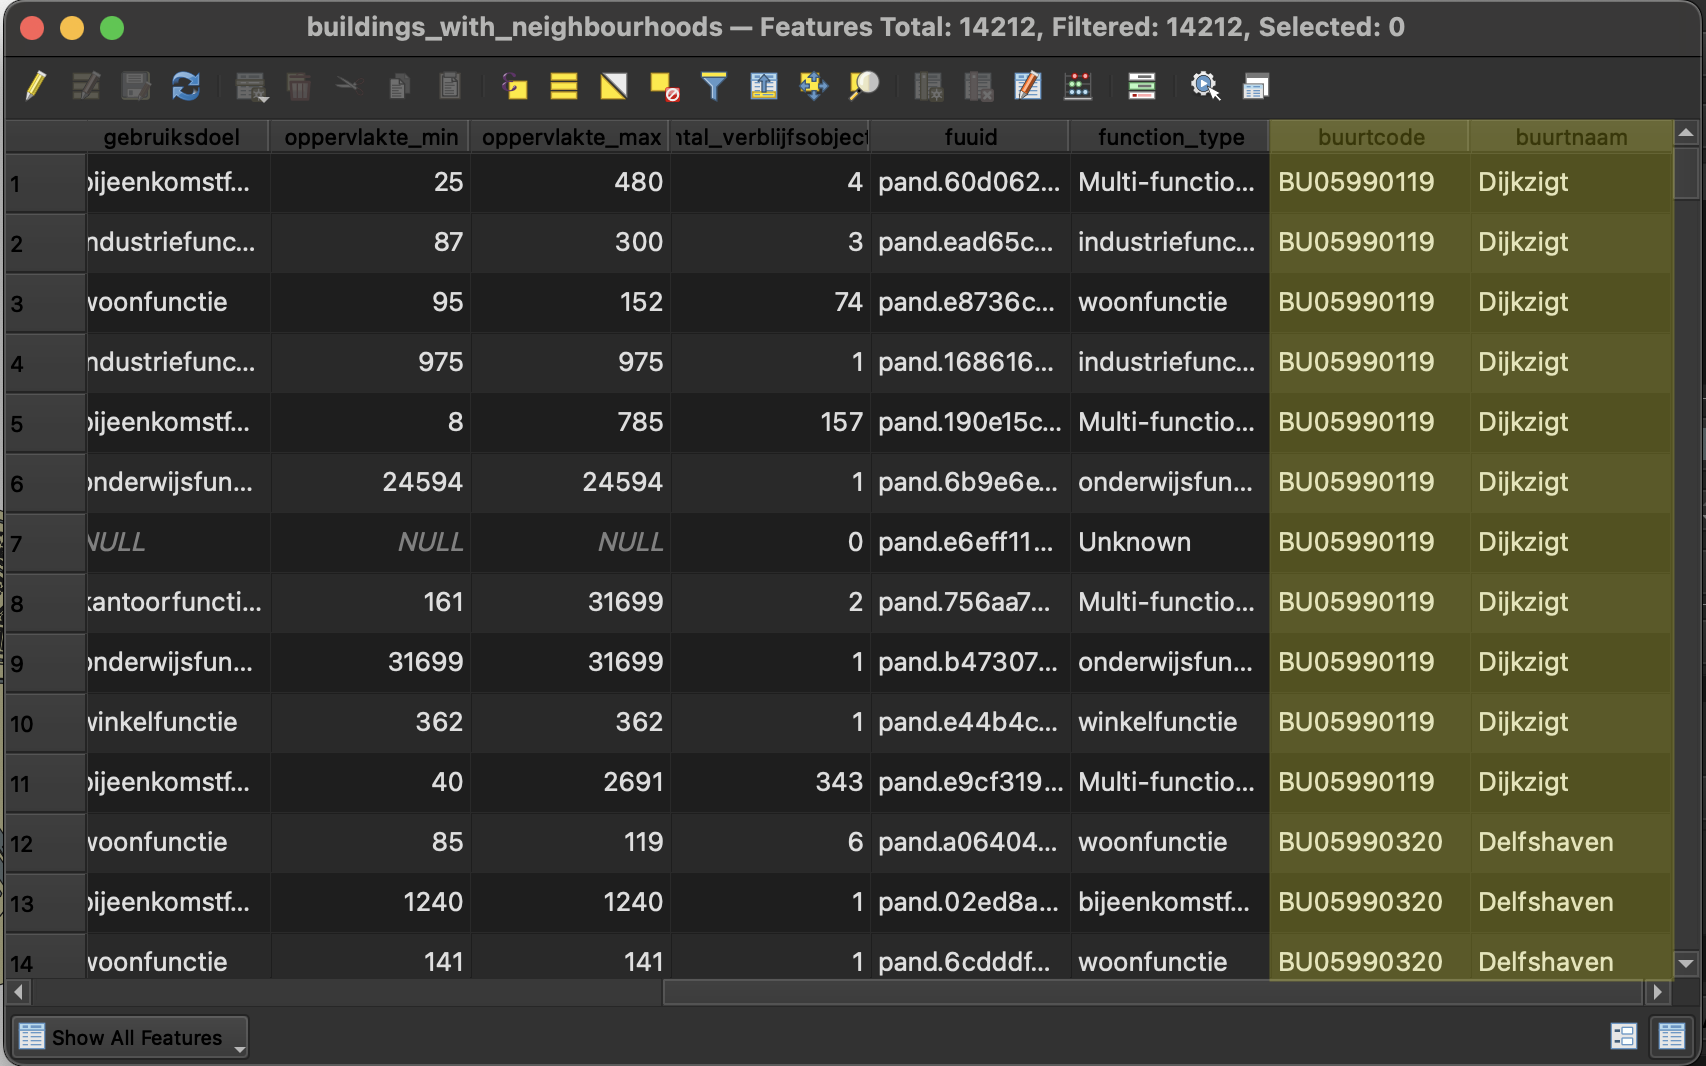
Verify the join:
Open the attribute table of the new
buildings_with_neighborhoodslayerCheck that the neighborhood name column has been added
Verify that buildings have the correct neighborhood assigned
⚠️ Troubleshooting: - If buildings show NULL in neighborhood field: They may be outside all neighborhood boundaries - If you see duplicate buildings: Check your geometric predicate and join type settings
Part 3: Calculate Building Areas
Step 3.1: Add Area Field
Open the attribute table of
buildings_with_neighborhoodsEnable editing mode
Open Field Calculator
Configure the area field:
- ☑ Create a new field
- Output field name:
area_m2 - Output field type:
Decimal number (real)
Enter this expression:
$areaThis calculates the area in square meters (since your CRS is EPSG:28992).
- Click OK
- Save edits and disable editing mode
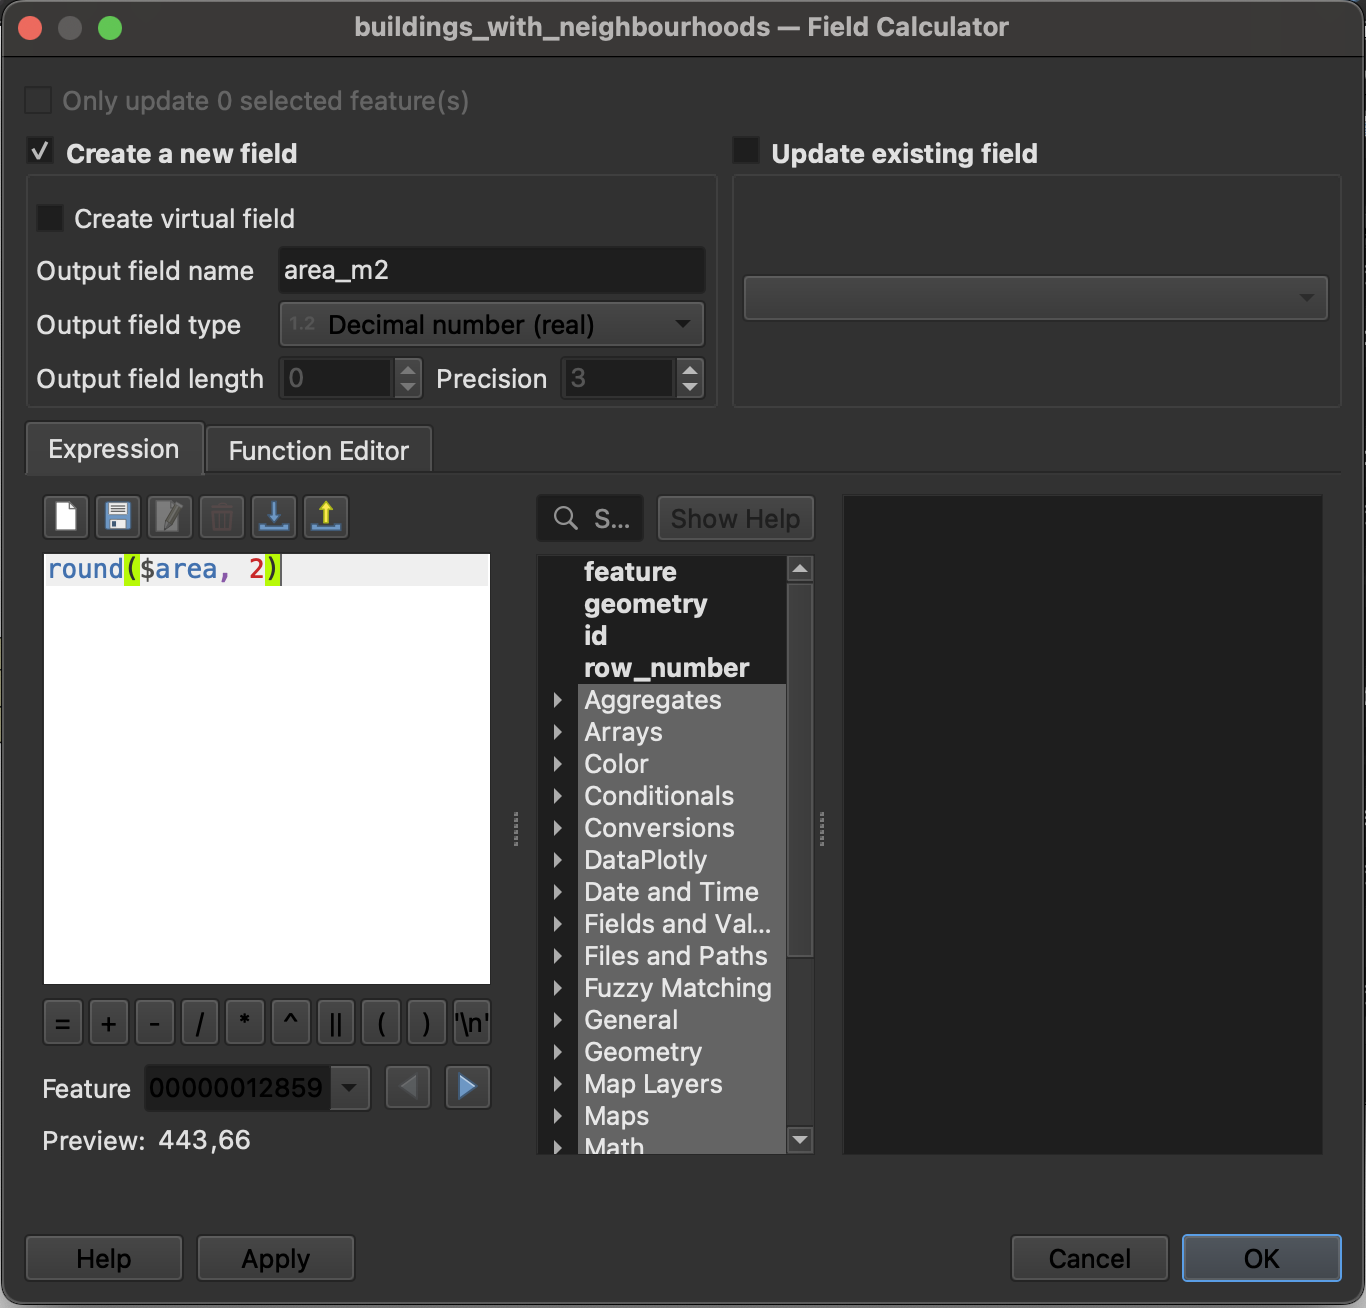
💡 Alternative expressions: - round($area, 2) - Round to 2 decimal places - $area / 10000 - Convert to hectares - For other CRS: area($geometry) is more explicit
Part 4: Calculate Statistics by Function and Neighborhood
Now we’ll aggregate the data to answer key questions: - How many buildings of each function type are in each neighborhood? - What is the total area of each function type per neighborhood?
Step 4.1: Statistics by Categories - Building Count
Go to:
Processing Toolbox→Vector Analysis→Statistics by CategoriesConfigure for building counts:
Input vector layer:
buildings_with_neighborhoodsField to calculate statistics on:
fid(or any unique ID field)Field(s) with categories:
- Click
...and select both:buurt_naam(neighborhood name)function_type(our created classification)
- Click
Statistics to calculate:
- ☑ Count (this counts buildings)
Output:
building_count_by_function.csvNoteThe tool doesn’t ask this to specify, but if the field to calculate on is not specified, it will only do count.

Click Run
Review the output:
- Open the CSV in QGIS or a text editor
- You should see columns:
buurt_naam,function_type,count - Each row represents: X buildings of type Y in neighborhood Z
Step 4.2: Statistics by Categories - Area Sum
Run Statistics by Categories again with different settings:
Configure for area totals:
- Input vector layer:
buildings_with_neighborhoods - Field to calculate statistics on:
area_m2 - Field(s) with categories:
buurt_naamfunction_type
- Statistics to calculate:
- ☑ Sum (total area)
- ☑ Mean (average building size - optional but useful)
- ☑ Count (number of buildings - to verify)
- Output:
building_area_by_function.csv
- Input vector layer:
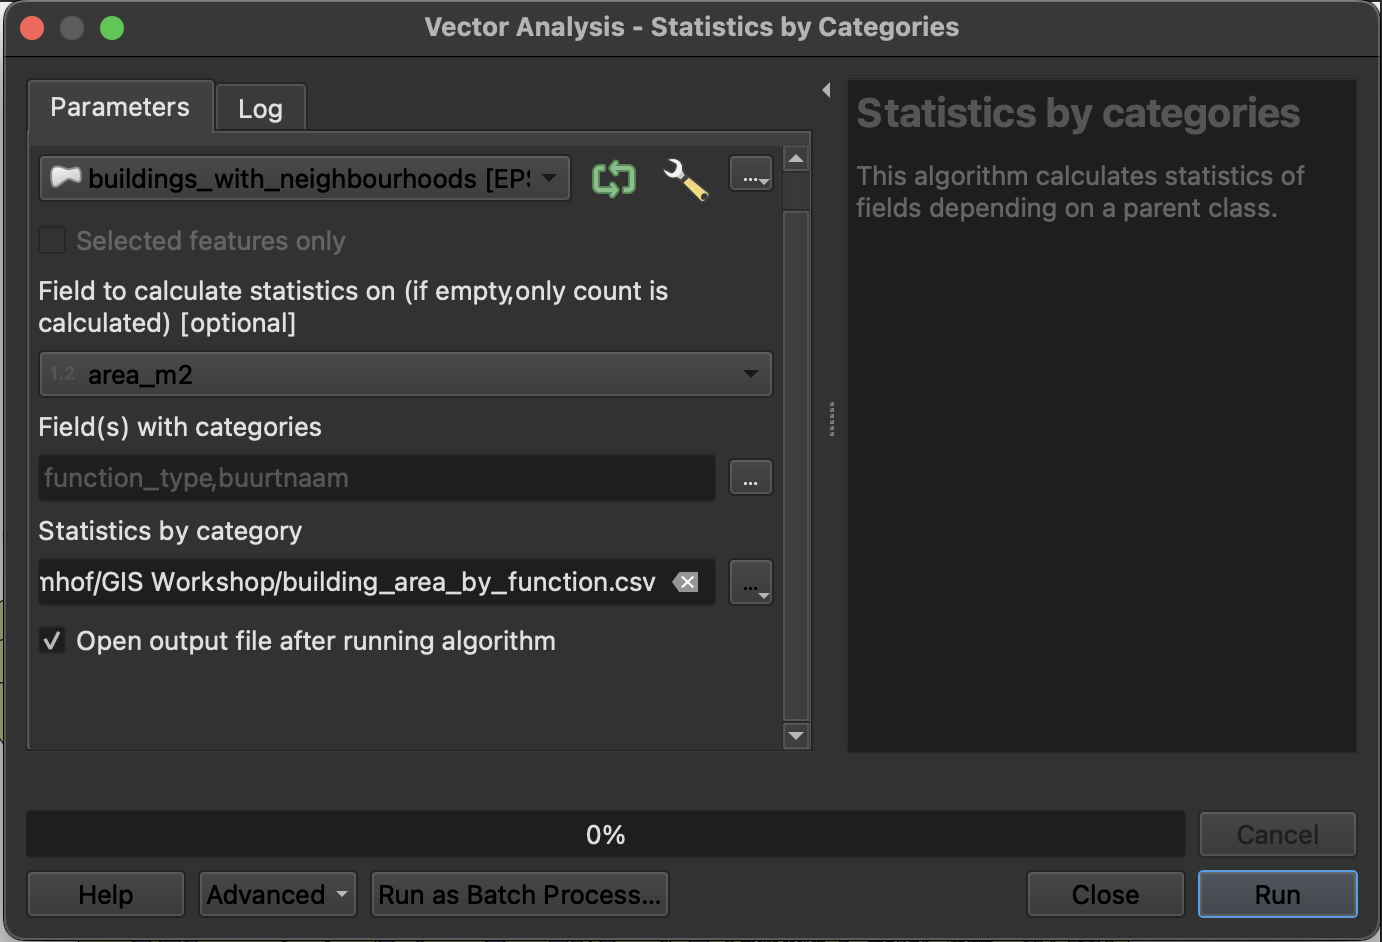
- Click Run
Step 4.3: Create a Comprehensive Summary Table (Alternative Method)
For more control, use the Aggregate tool:
Go to:
Processing Toolbox→Vector Analysis→AggregateConfigure:
- Input layer:
buildings_with_neighborhoods - Group by expression: Click
εbutton and build expression:
- Input layer:
"buurtnaam" || ' - ' || "function_type"This creates unique groups for each neighborhood-function combination.
Aggregates: Click
...to configure multiple statistics:Add these aggregations:
Expression Aggregate Name Type Length Precision fid- building_countInteger (64 bit) 10 2 "area_m2"sumtotal_area_m2Decimal (Double) 10 2 "area_m2"meanavg_area_m2Decimal (Double) 10 2 "area_m2"minmin_area_m2Decimal (Double) 10 2 "area_m2"maxmax_area_m2Decimal (Double) 10 2 Also add these to preserve grouping info:
Expression Aggregate Name Type Length Precision "buurtnaam"first_valueneighborhoodText (string) 50 0 "function_type"first_valuefunctionText (string) 50 0
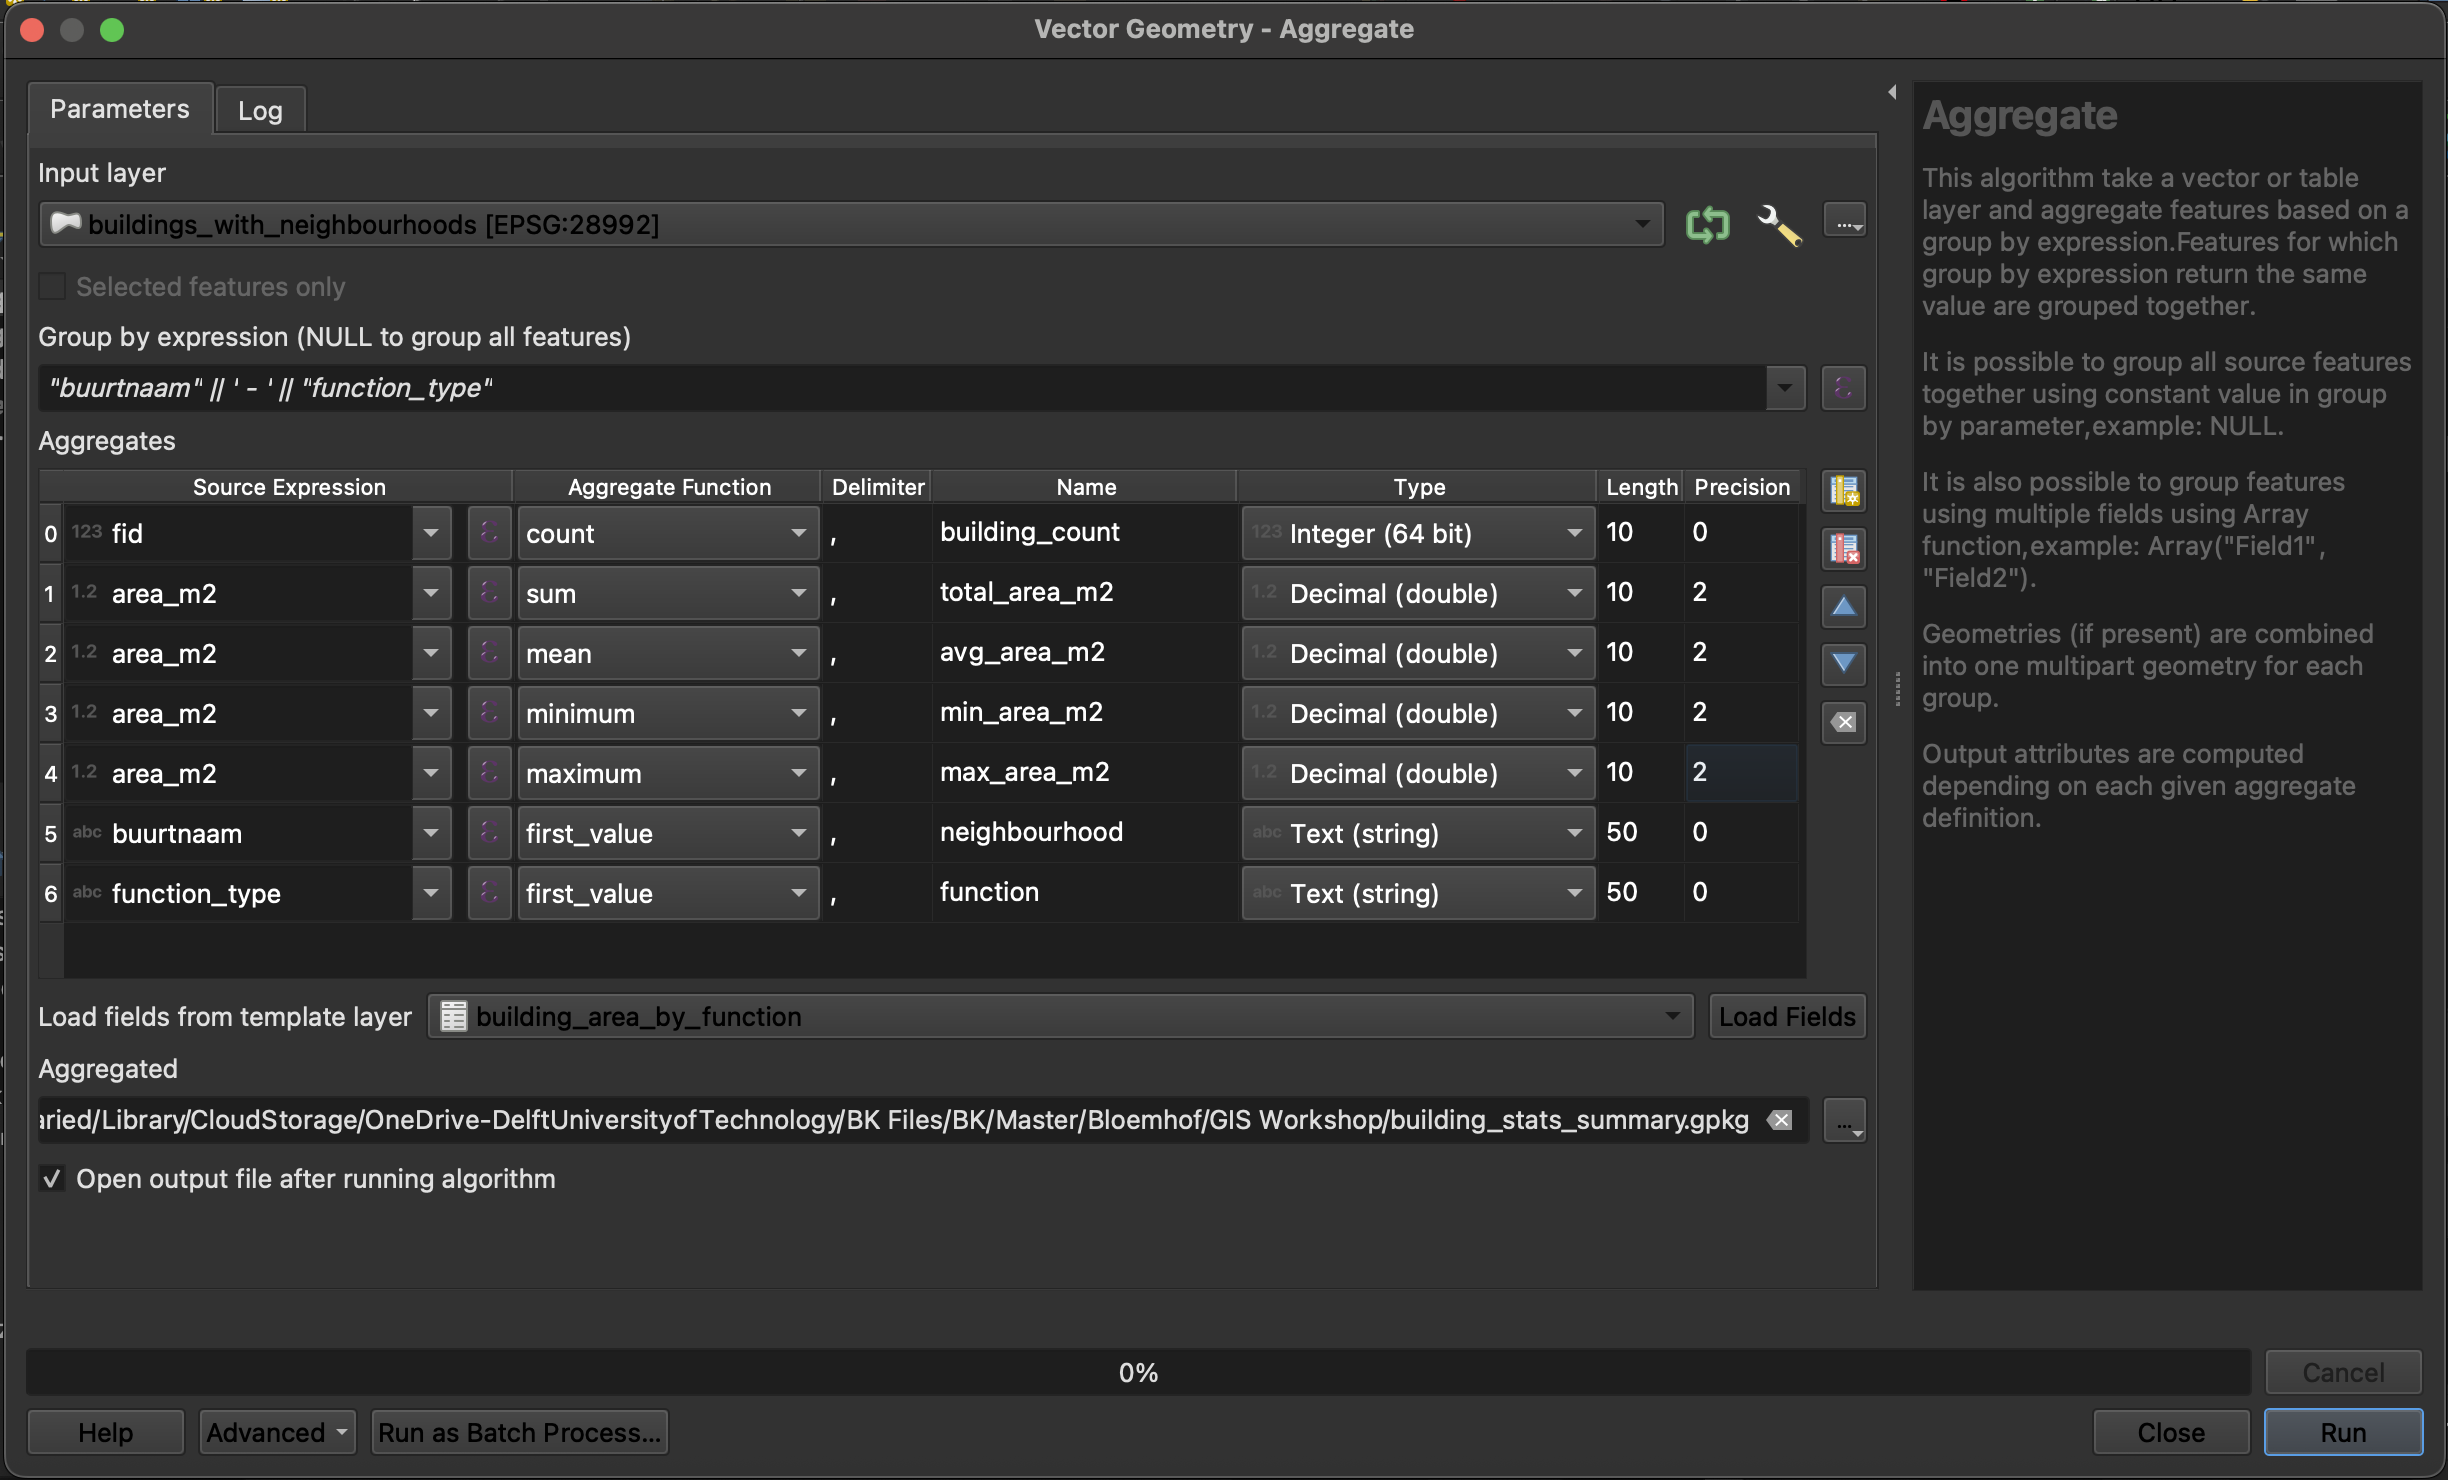
Aggregated layer: Save as
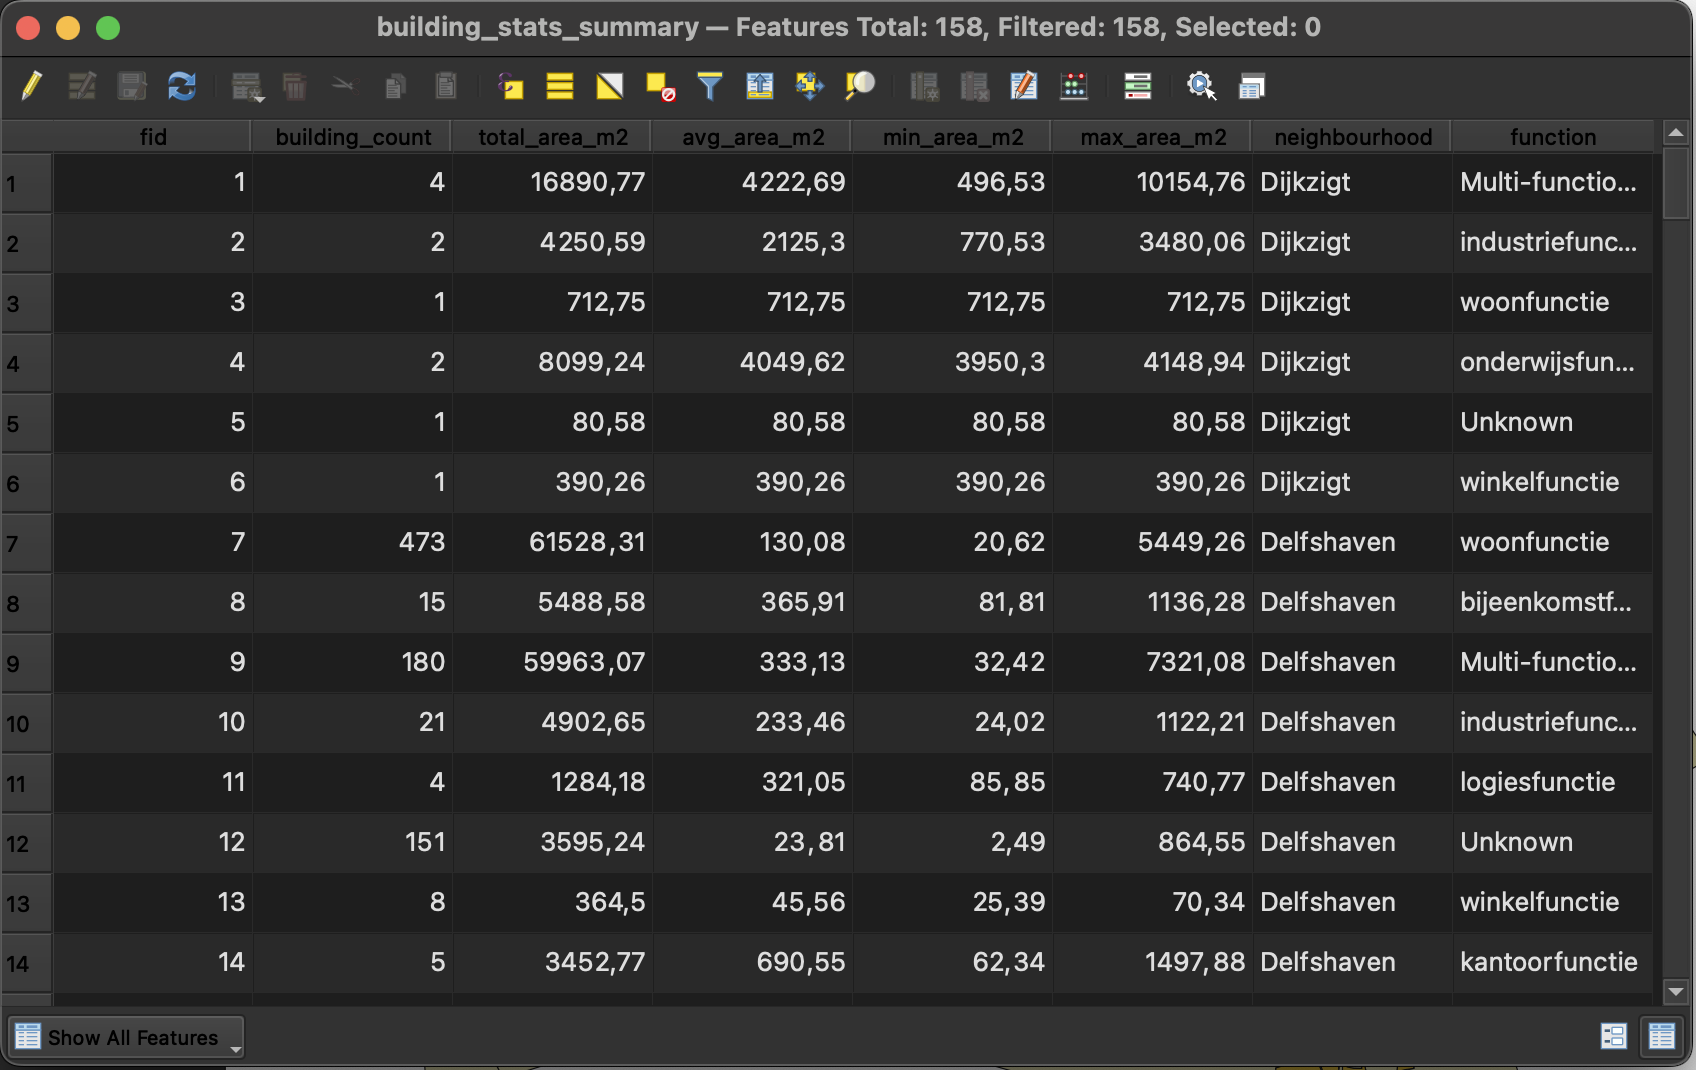
building_stats_summary.gpkgClick Run
Review the results:
Open the attribute table
You now have comprehensive statistics for each neighborhood-function combination
Each row = one function type in one neighborhood with count, total area, and size statistics
Part 5: Export and Visualize Data
Step 5.1: Prepare Data for Visualization
Open the attribute table of your statistics layer (
building_stats_summary)Export to CSV:
- Right-click the layer →
Export→Save Features As... - Format:
Comma Separated Value [CSV] - File name:
rotterdam_building_stats.csv - Geometry: Select
No geometry(we only need the statistics) - Select fields to export:
- ☑
neighborhood - ☑
function - ☑
building_count - ☑
total_area_m2 - ☑
avg_area_m2 - Uncheck
fidand other unnecessary fields
- ☑
- Right-click the layer →
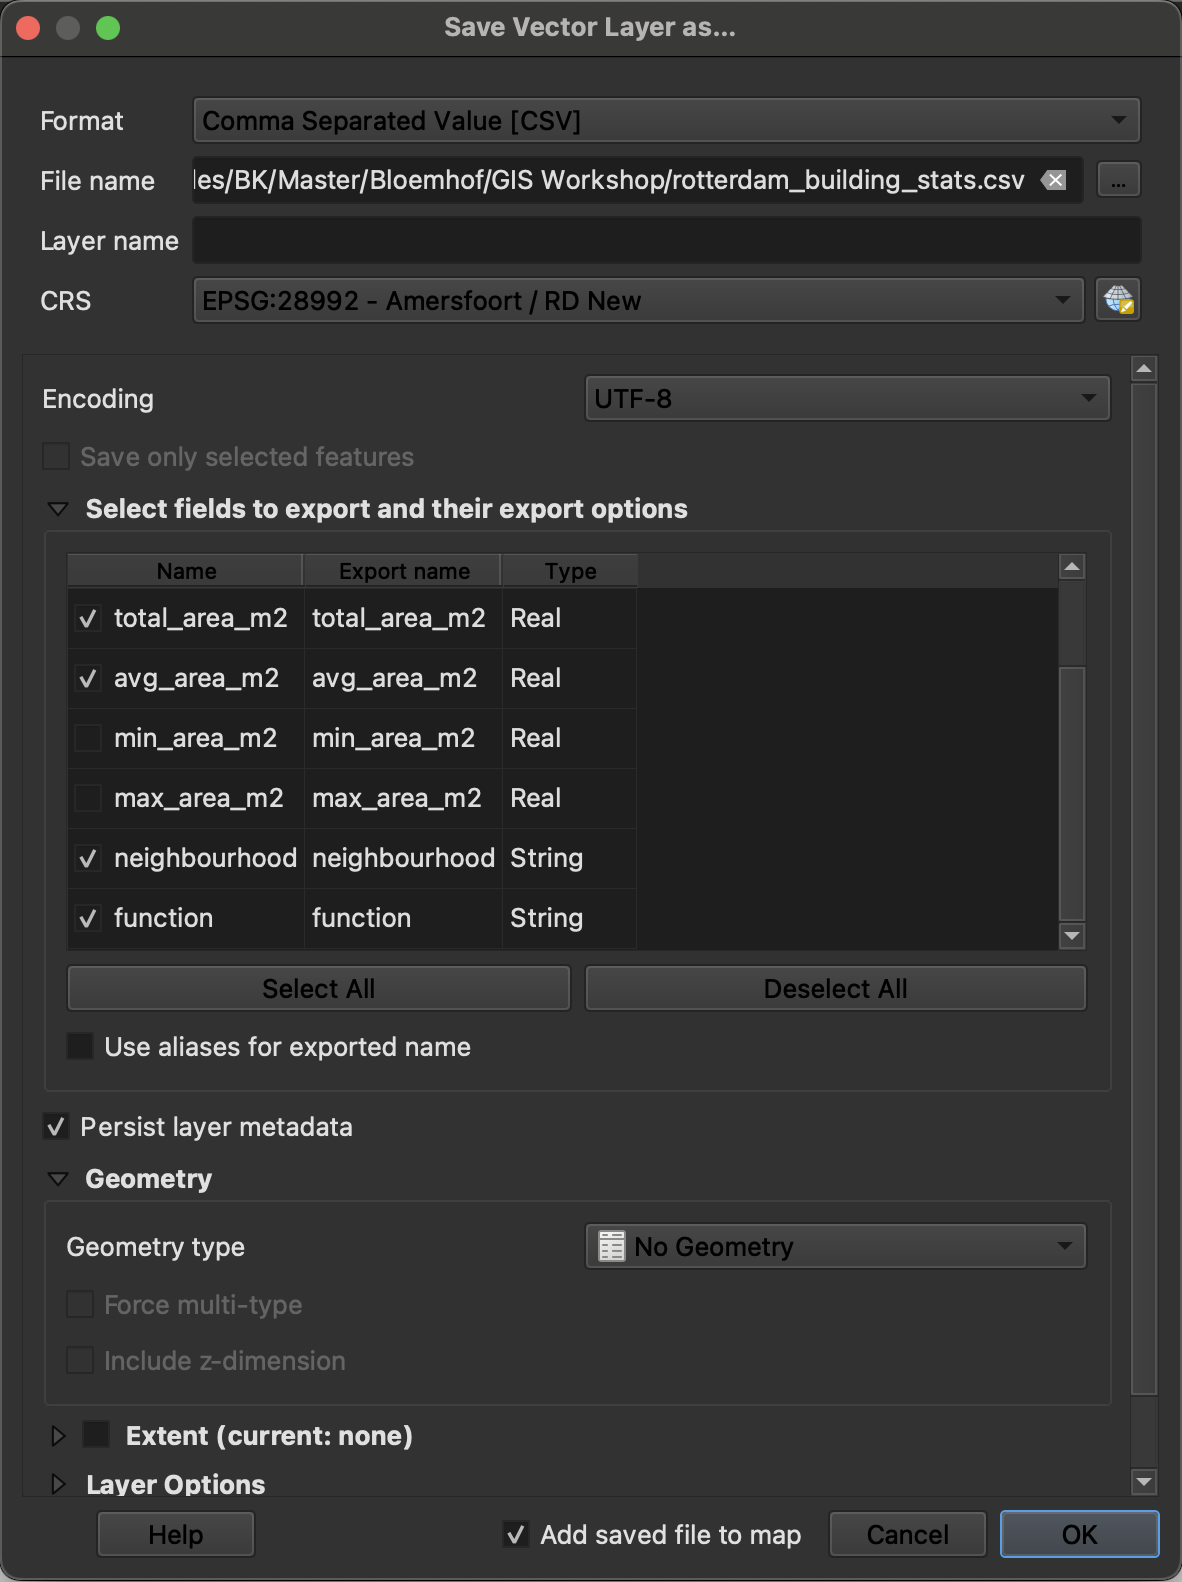
Click OK
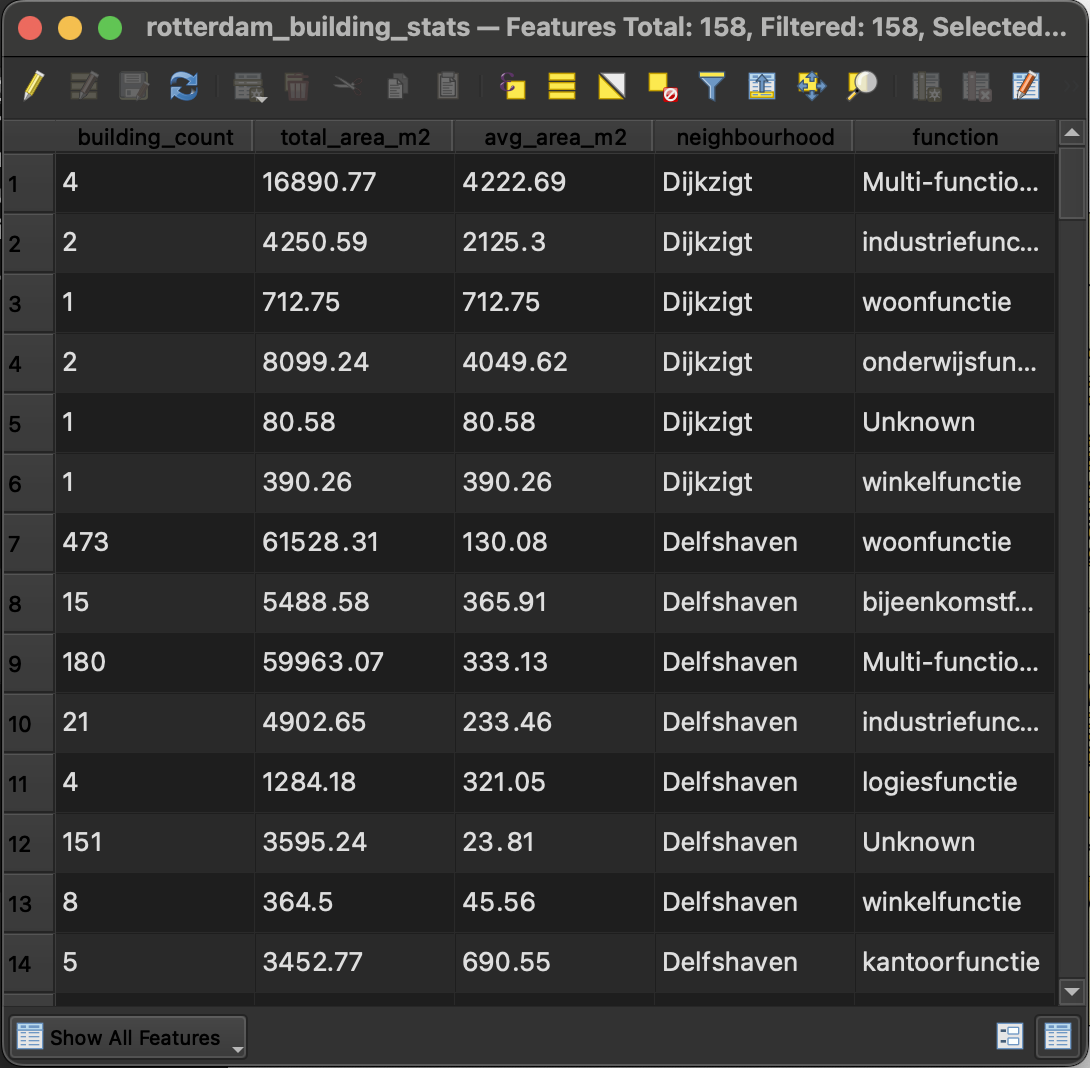
Verify your export:
Open the CSV in a text editor or spreadsheet
Check headers are clear
Verify data looks correct
Step 5.2: Create Visualizations in RAWGraphs
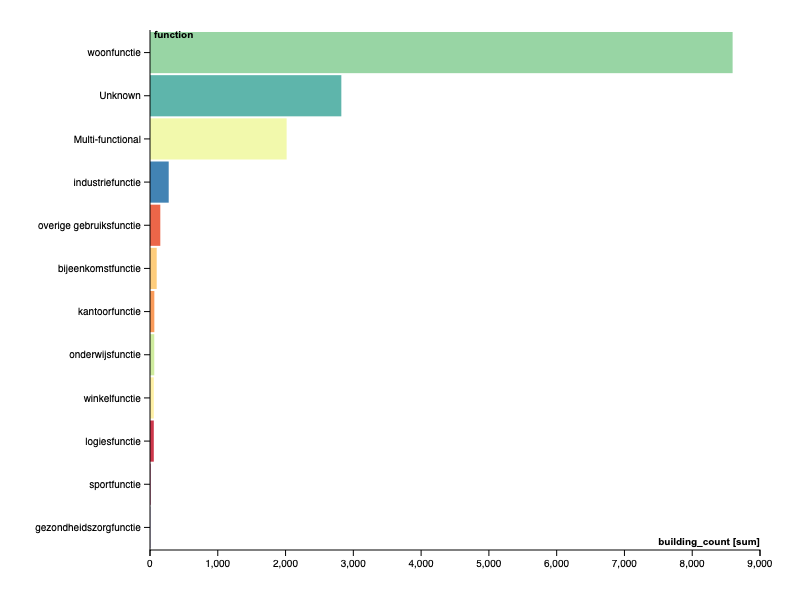
Visualization 1: Bar Chart - Building Count by Function
- Open RAWGraphs: https://app.rawgraphs.io/
- Load your data: Upload
rotterdam_building_stats.csv - Choose chart: Select Bar chart
- Map dimensions:
- Bars:
function - Size:
building_count - Color:
neighborhood(optional - will show stacked bars)
- Bars:
- Customize:
- Sort by: Value (descending) to show most common functions first
- Orientation: Horizontal (easier to read function names)
- Color scheme: Choose a categorical palette
- Export: Download as SVG
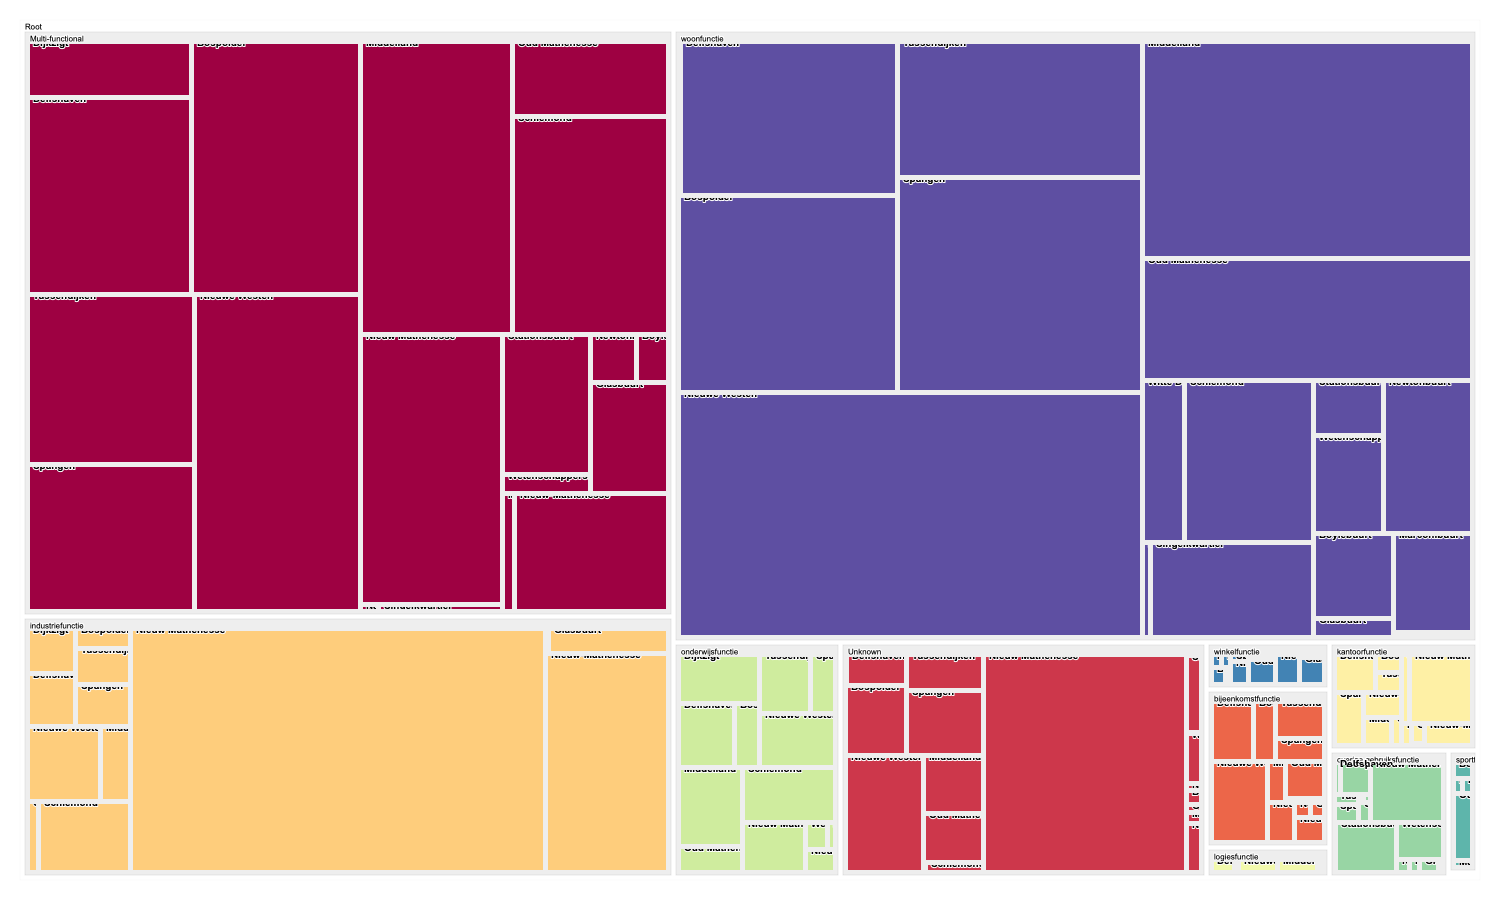
Visualization 2: Treemap - Area Distribution
- Start new chart in RAWGraphs
- Choose chart: Select Treemap
- Map dimensions:
- Hierarchy:
- First level:
function - Second level:
neighborhood
- First level:
- Size:
total_area_m2 - Color:
function - Label:
neighborhood
- Hierarchy:
- Customize:
- Adjust padding for readability
- Choose color scheme (qualitative)
- Enable/disable labels based on size
- Export: Download as SVG
Visualization 3: Grouped Bar Chart - Compare Neighborhoods
- Start new chart
- Choose chart: Select Bar chart
- Map dimensions:
- X axis:
neighborhood - Y axis:
building_count - Color:
function - Series: Leave empty for grouped bars
- X axis:
- Customize:
- Sort by: Total value to rank neighborhoods
- Enable legend
- Adjust colors for function types
- Export: Download as SVG

Summary Table: Statistics You’ve Calculated
| Statistic | Method | Answers the Question |
|---|---|---|
| Building Count by Function | Statistics by Categories | How many buildings of each type in each neighborhood? |
| Total Area by Function | Statistics by Categories | What’s the total floor area per function type? |
| Average Building Size | Aggregate tool | What’s the typical building size per function? |
| Neighborhood Rankings | Sort aggregated data | Which neighborhoods have most buildings/area? |
Key QGIS Concepts Used
1. Field Calculator Expressions
Conditional Classification:
CASE
    WHEN condition THEN result
    ELSE alternative
END
String Functions: - length() - Count characters - replace() - Replace text - trim() - Remove whitespace
2. Spatial Predicates
| Predicate | Description | Use Case |
|---|---|---|
| within | Feature completely inside | Buildings entirely within neighborhoods |
| intersects | Features touch or overlap | Include buildings on borders |
| contains | Opposite of within | Which neighborhood contains building |
3. Aggregation Functions
| Function | Purpose |
|---|---|
count() |
Count features |
sum() |
Add up values |
mean() |
Calculate average |
min()/max() |
Find extremes |
Common Issues and Solutions
Issue 1: Buildings missing neighborhood names after join
Cause: Buildings are outside all neighborhood boundaries
Solution: - Check your spatial selection first - Verify CRS matches for both layers - Use “intersects” instead of “within” if buildings are on boundaries - Inspect the map visually to confirm coverage
Issue 2: Duplicate buildings in results
Cause: Join type is set to “one-to-many” and buildings overlap multiple neighborhoods
Solution: - Use “within” predicate (more strict) - Check for buildings actually on boundaries - decide which neighborhood they should belong to - Use “Create separate features for each located feature (one-to-one)” join type
Issue 3: Area values are enormous or tiny
Cause: CRS is in degrees instead of meters, or area unit confusion
Solution: - Verify your CRS is EPSG:28992 (projected coordinate system) - Check Project → Properties → CRS - Reproject layers if needed: Vector → Data Management Tools → Reproject Layer
Issue 4: Function names are inconsistent
Cause: Raw data has variations in naming or spelling
Solution: - Use Field Calculator to standardize:
CASE
    WHEN "function" ILIKE '%woon%' THEN 'Residential'
    WHEN "function" ILIKE '%winkel%' THEN 'Retail'
    -- etc.
END
Extension Activities
Temporal Analysis: If you have multi-year building data, compare how building functions change over time
Density Calculations: Calculate building density (buildings per hectare) and function diversity per neighborhood
Advanced Classification: Create more detailed function categories:
- Residential (single-family vs. multi-family)
- Commercial (retail vs. office)
- Create a function_category hierarchy
Spatial Statistics: Calculate nearest neighbor distances for each function type
Dashboard Creation: Combine multiple visualizations with descriptive text in a report
Interactive Mapping: Use QGIS2Web or qgis2threejs to create interactive maps showing statistics
Checklist
Before finishing, verify you have:
- ☑ Created
function_typefield classifying single vs. multi-functional buildings - ☑ Performed spatial selection of buildings within neighborhoods
- ☑ Executed spatial join to append neighborhood names
- ☑ Calculated building areas in square meters
- ☑ Generated statistics: building count per function per neighborhood
- ☑ Generated statistics: total area per function per neighborhood
- ☑ Exported clean CSV with relevant fields only
- ☑ Created at least 2 different visualizations in RAWGraphs
- ☑ Saved all intermediate and final outputs in your project folder
Additional Resources
QGIS Documentation: - Vector analysis tools - Field calculator functions - Spatial queries
RAWGraphs: - Learning resources - Chart gallery
Data Visualization: - ColorBrewer - Choose appropriate color schemes - Data Viz Project - Encyclopedia of visualization types