
Urban Stream Restoration in Dresden
Researching the optimal locations to restore the urban streams in order to improve the biodiversity, climate adaptivity and quality of life in the city of Dresden
| Name | Affiliation | Role |
|---|---|---|
| Daan Schlosser | MSc Geomatics | Project coordinator & data-analyst |
| Joost Bastiaansen | MSc Urbanism | Mapping specialist |
| Aparnaa Chandrasekaran | MSc Urbanism | Research lead |
| Teun van Dijk | MSc Urbanism | Presentation & design lead |
1 Introduction
1.1 Context
The ReBioClim project started in 2024 as part of the Interreg Central Europe funding programme of the European Union for regional and transnational development. This project focuses on urban stream restoration, aiming to promote biodiversity, support climate adaptation, and improve quality of life in cities (Interreg Central Europe, 2025). The project stems from the concept of Urban Stream Syndrome, which describes the consistent ecological degradation of watercourses that drain urban areas. In such areas, peak discharge rates during flood events are significantly higher, while baseflow is reduced due to decreased infiltration (Walsh et al., 2005). This is caused by the proliferation of impermeable surfaces—such as roads, rooftops, and parking lots—combined with more efficient stormwater drainage via pipelines. The combination of increased hard surfaces and efficient drainage results in a “flashier” hydrograph, leading to more frequent and intense flow events with rapidly rising and falling water levels. This contributes to symptoms of Urban Stream Syndrome, including increased bank erosion and greater channel incision. Other consequences include elevated concentrations and loads of chemical pollutants and nutrients in urban streams, all of which negatively impact biodiversity (Walsh et al., 2005).
With climate change, the urgency to address the limitations of urban drainage systems is growing (Arnbjerg-Nielsen et al., 2013). Impact assessments of urban runoff consistently show that, in regions affected by climate change, systematic adaptation is required to mitigate the poor performance of existing drainage systems—particularly in high-risk areas such as cities located along rivers (Arnbjerg-Nielsen et al., 2013). Some studies suggest that, despite the challenges posed by climate change, systematic restoration of urban streams can reduce the impacts of Urban Stream Syndrome to an acceptable level—one of the main goals of the Urban Stream Restoration project.
1.2 Dresden
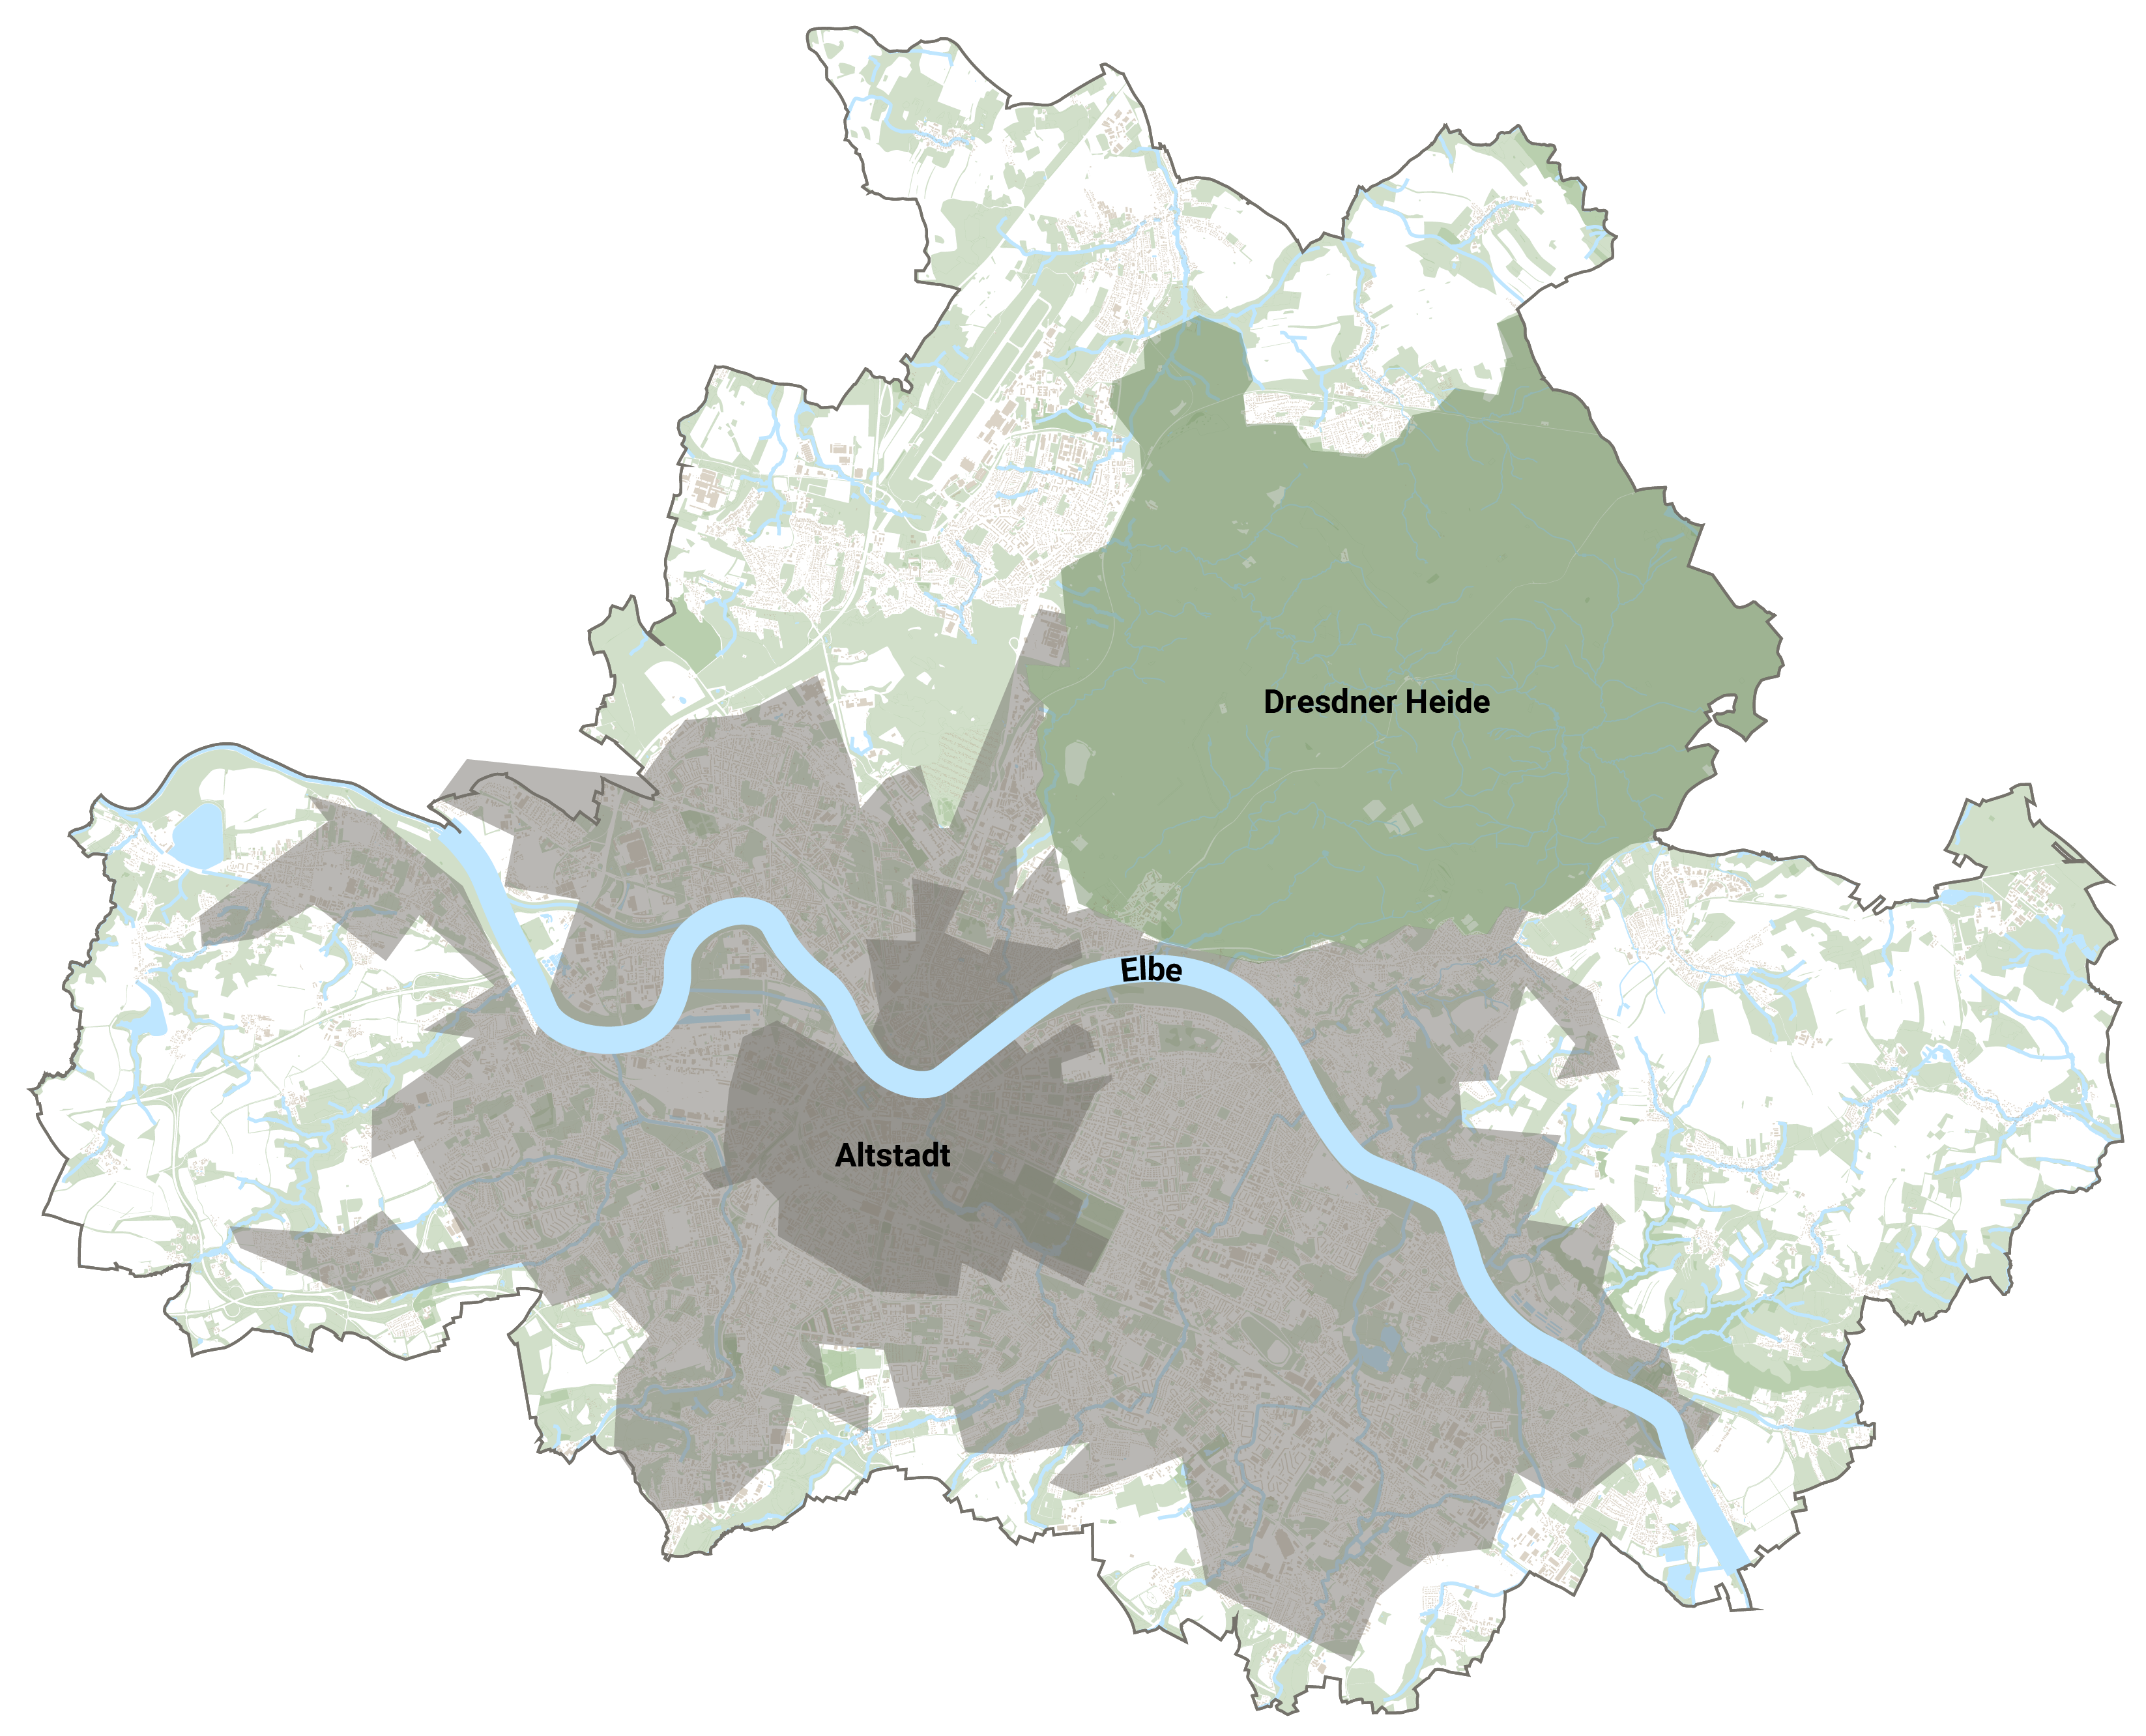
One of the participating cities in the ReBioClim project is Dresden, located in Germany. In addition to its historical significance, Dresden is an important centre of trade due to its position along the River Elbe, which provides a direct connection to Hamburg. The city is also geographically linked to the Sächsische Schweiz, a mountain range renowned for its distinctive sandstone rock formations. The combination of Dresden’s location along the Elbe and its proximity to this elevated region has resulted in an extensive network of streams, totalling 347 kilometres. This makes the city particularly susceptible to Urban Stream Syndrome, as well as to the increasing impacts of climate change (Arnbjerg-Nielsen et al., 2013).
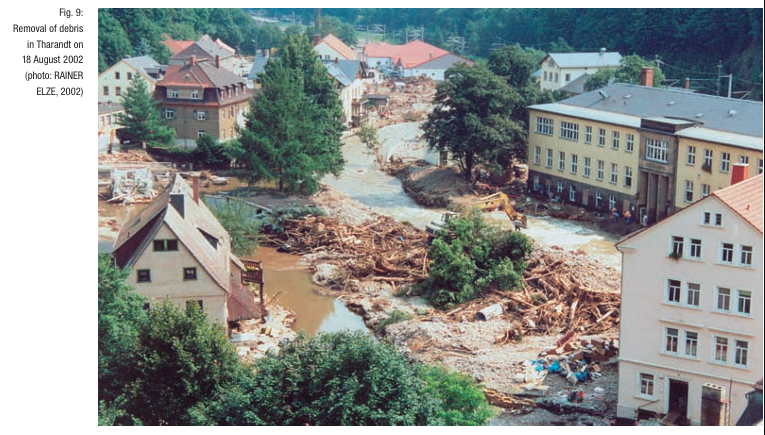
This became apparent in 2002, when Dresden was struck by a severe flood (Sächsisches Landesamt für Umwelt und Geologie, 2002). Over two metres of rain fell in just three days across large parts of the Osterzgebirge mountain range—two to three times the average rainfall for the entire month of August. Due to preceding moisture and geological conditions, the ground was already saturated and could absorb little additional water. As a result, 60 to 90 per cent of the rainfall rapidly ran off in many areas. At the time, the runoff infrastructure was far from adequate to manage this volume of water, leading to substantial damage and destruction across the affected region.
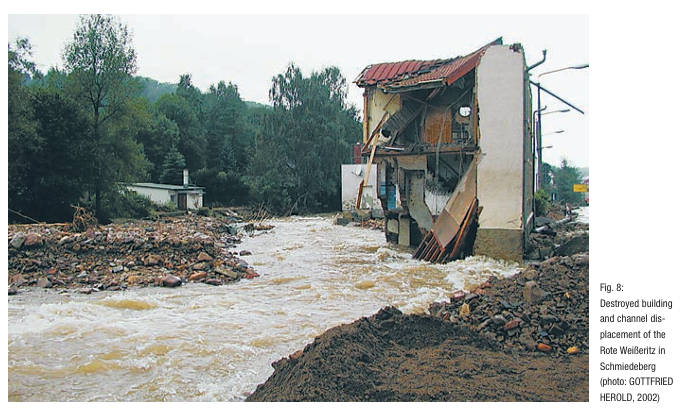
The watercourses in urban areas were almost entirely canalised, and the banks were reinforced—even beyond urban boundaries (Sächsisches Landesamt für Umwelt und Geologie, 2002). Dams, bridges, and other structures along the channels significantly reduced local discharge capacity. In all affected areas, these bottlenecks were identified as points where the available discharge profile was completely inadequate.
The result was more than a billion euros in damage and multiple fatalities. Although the August 2002 flood had a statistical return period of 100 to 500 years, a more extensive analysis revealed that similar events could occur at any time across the studied streams. The analysis (Sächsisches Landesamt für Umwelt und Geologie, 2002) also indicated that the August flood was not the maximum physically possible event, meaning future floods more severe than that of 2002 cannot be ruled out. In 2013, a similar event occurred, when a combination of late snowmelt and several wet spring months resulted in saturated soils and full reservoirs (KNMI - Central European Flooding 2013, n.d.). Although the magnitude of the Elbe flooding was lower than in 2002, the damage and casualties were comparable.
1.3 Urban Stream Restoration
To mitigate the impact of similar future events, the Sachsen region and the city of Dresden were strongly motivated to develop an integrated, sustainable drainage system. To achieve this, several goals were established (Sächsisches Landesamt für Umwelt und Geologie, 2002). These included giving streams more space by widening them and restricting real estate development in flood-prone areas. Furthermore, hydraulic drainage systems required a larger discharge profile and greater attention to erosion. Lastly, a focus was placed on the decentralised retention of runoff, particularly by influencing land use around urban stream reservoirs. This involved promoting ecological or recreational land uses instead of industrial or residential developments, in order to increase the overflow capacity of streams. These principles aimed not only to improve climate adaptation and biodiversity, but also to enhance the quality of life for nearby residents.
Dresden’s commitment to sustainable urban development is exemplified by its landscape plan, which envisions a “compact city within an ecological network” (Artmann et al., 2017). This approach emphasises the integration of green and blue infrastructure to improve air and water quality, reduce urban heat island effects, and enhance biodiversity. Increasing infiltration and evapotranspiration is intended to mitigate flood risks and support climate change adaptation.
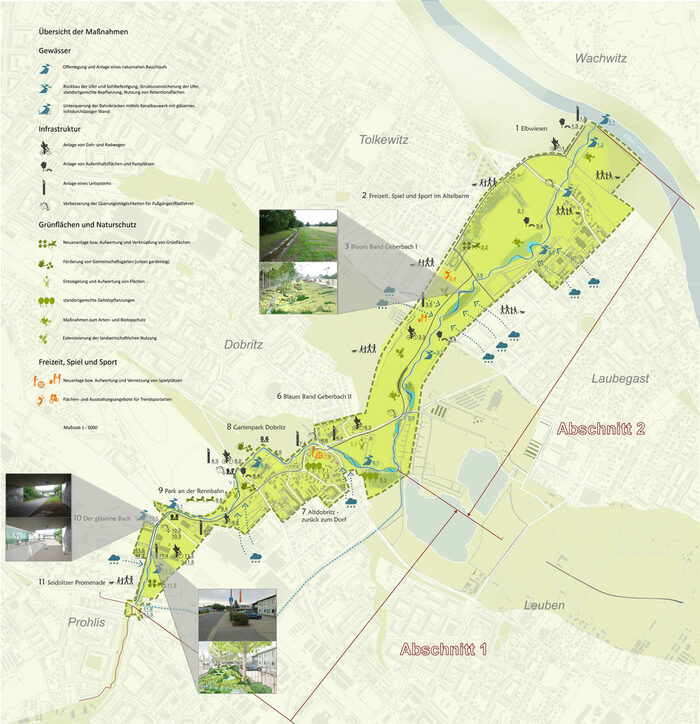
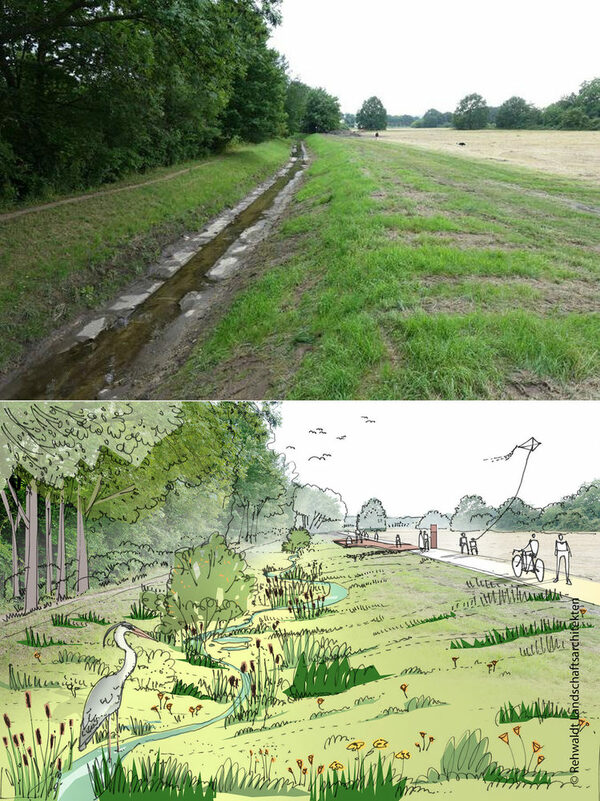
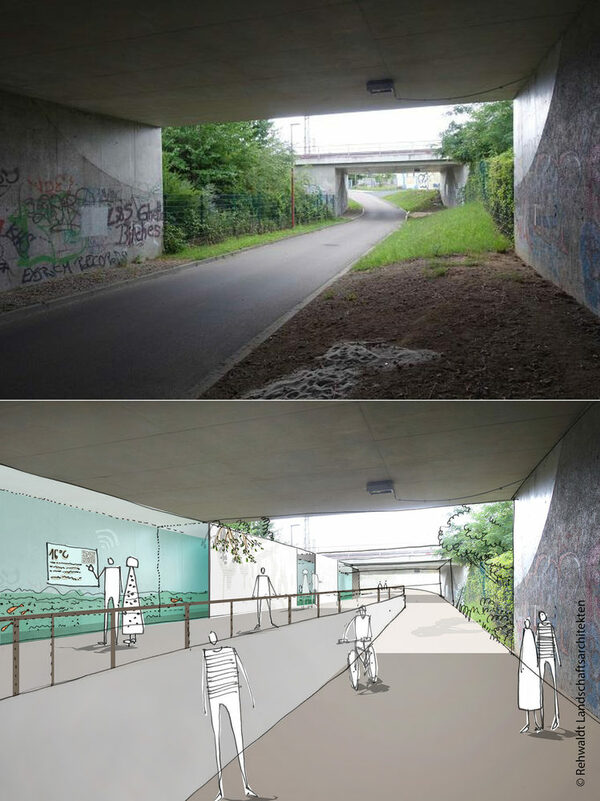
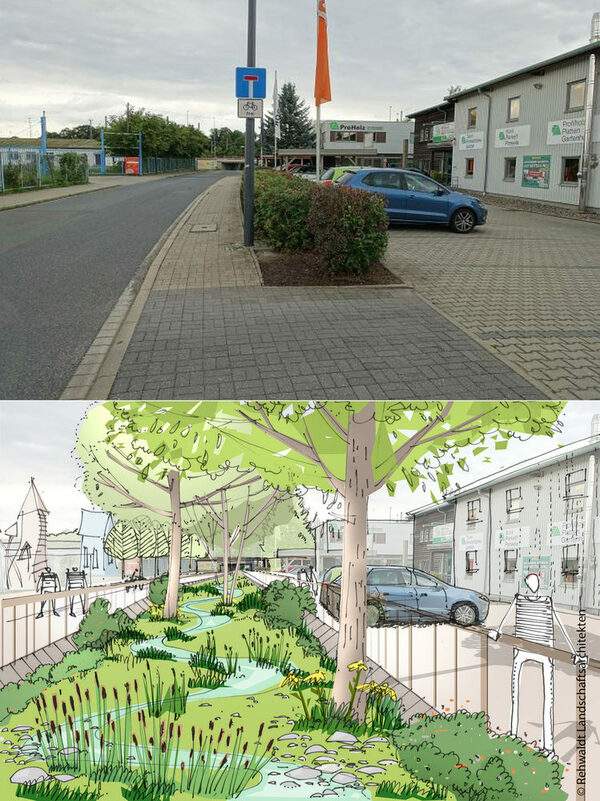
This aligns with the Urban Stream Restoration project. In Dresden, pilot actions under this initiative include stakeholder co-design workshops, restoration plans, and initial implementation activities. One example is the Blaues Band Geberbach, where, in collaboration with the community, space is reclaimed to restore the stream and its surroundings (Dresden, 2025). This project requires the integration of various aspects, including land use, infrastructure, and biodiversity. For instance, land from a horse racing track is repurposed to create a new cycle path, while construction activities are used as an opportunity to install a district heating system.
These efforts aim to develop socially integrated solutions that balance ecological objectives with urban planning needs. However, such projects are time-consuming and costly to implement. Consequently, not every stream can be restored simultaneously, making it essential to prioritise locations with the highest suitability. This leads to the following research question and sub-research questions:
Which urban stream sections in Dresden have the greatest potential to contribute to the city’s integrated climate resilience?
- Which areas around urban streams are most vulnerable to flooding due to climate change?
- Which areas along urban streams are most urgent to enhance residents’ day-to-day quality of life?
- Which stream corridors have the highest potential to support and enhance urban biodiversity?
2 Methods
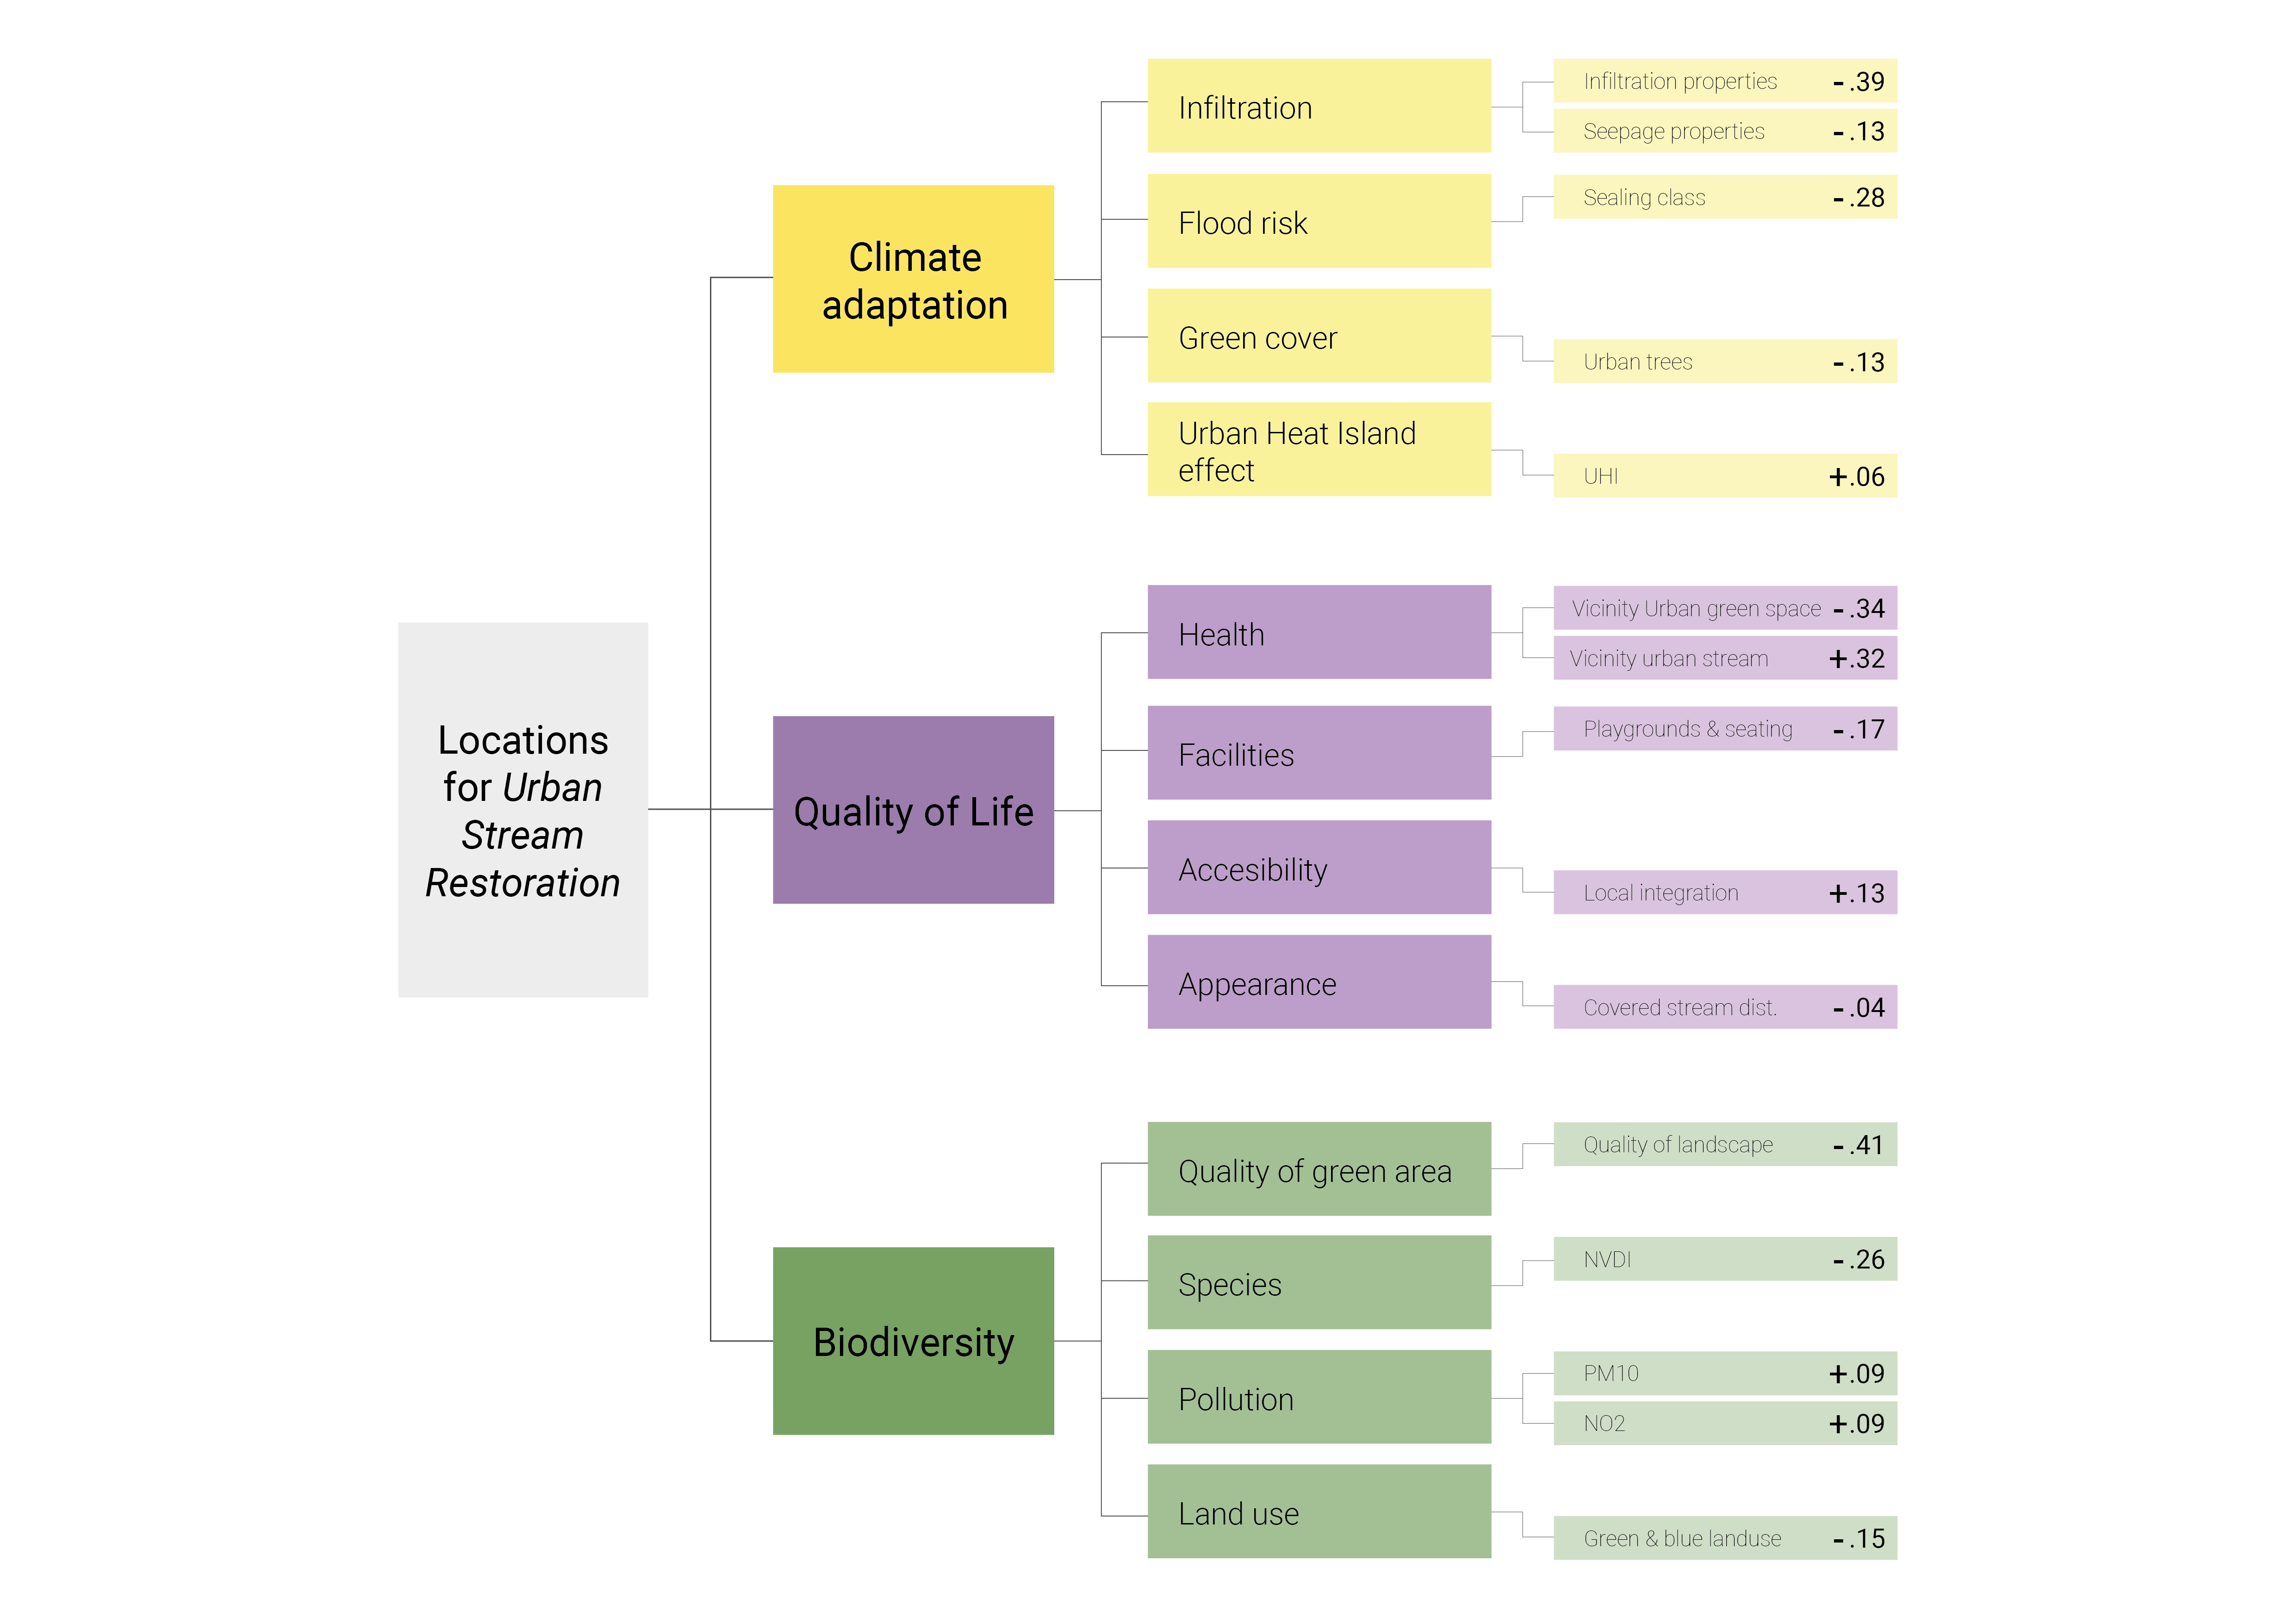
To answer the main research question, it is important to select appropriate methods that consider environmental, social, and economic factors (Convertino et al., 2012). Clear metrics are required to measure the impact of restoration activities at various stages of the project. These metrics are based on three key themes, aligned with the goals of the ReBioClim project: climate adaptation, quality of life, and biodiversity. A literature review forms the basis for identifying which data are relevant to address the sub-questions and the main research question. It also explains the significance of each theme and how they are interconnected within the datasets. The structure of the research is schematised below.
2.1 Site Selection and Unit of Analysis
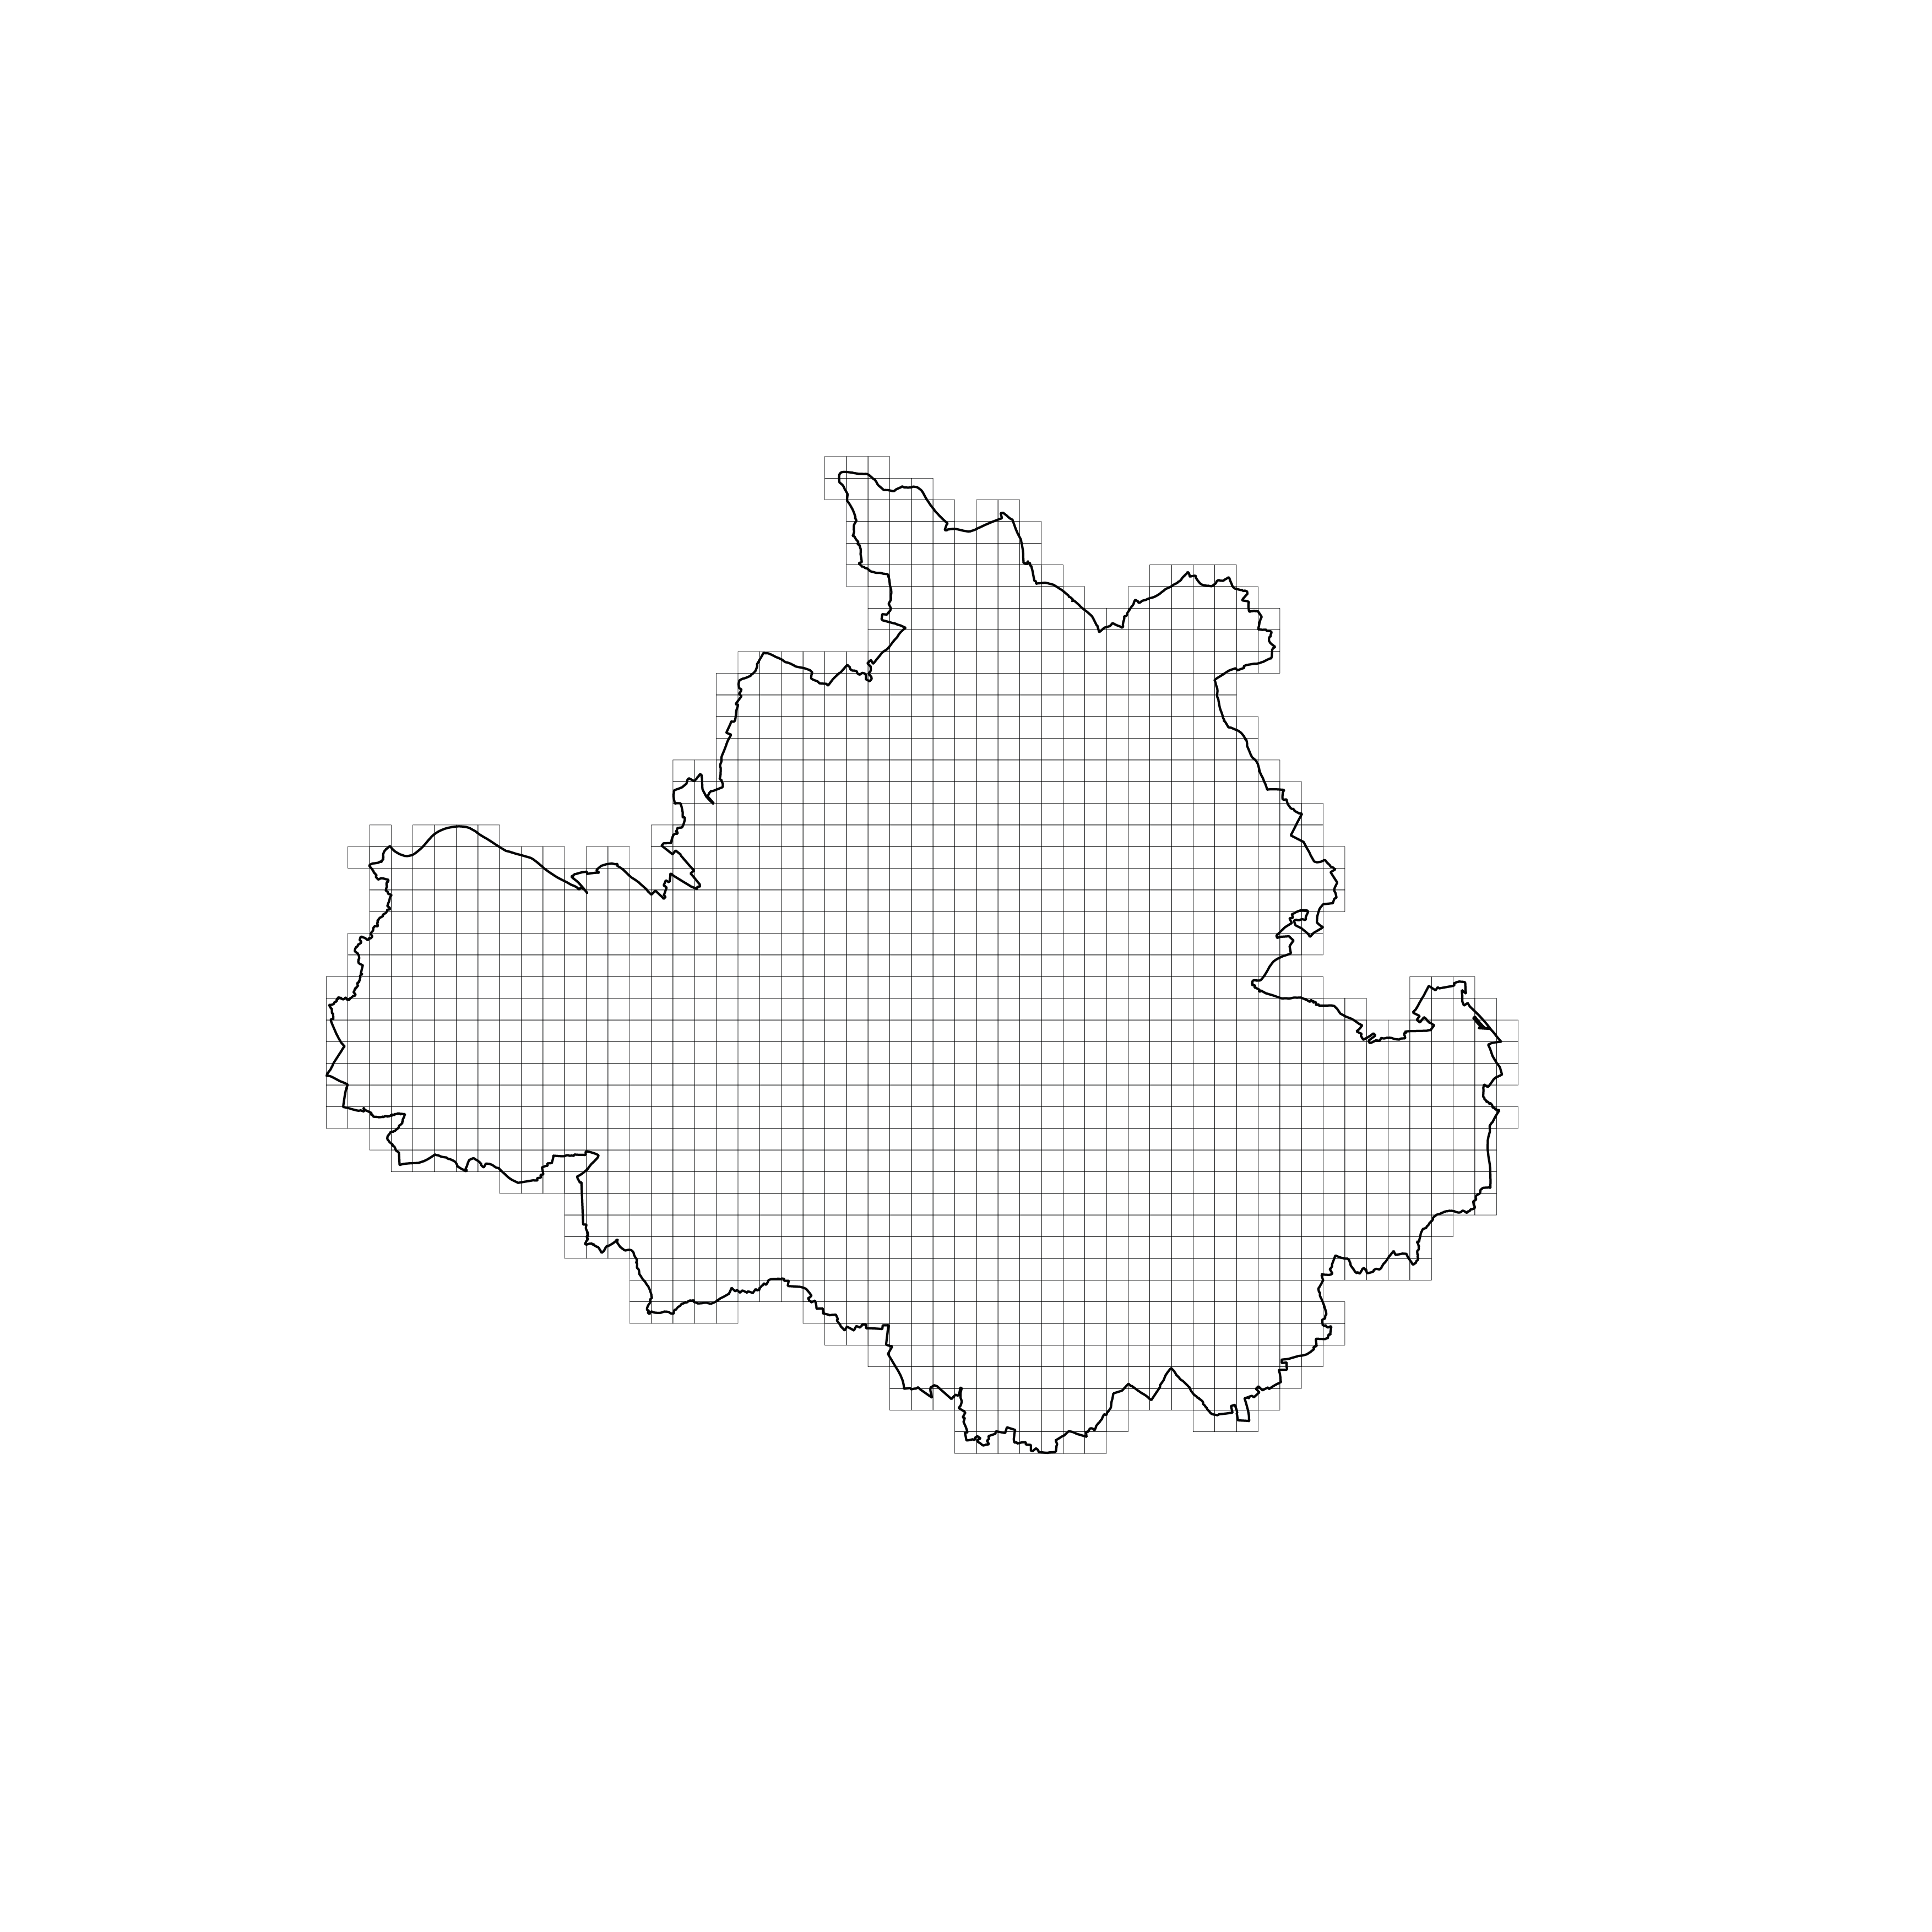
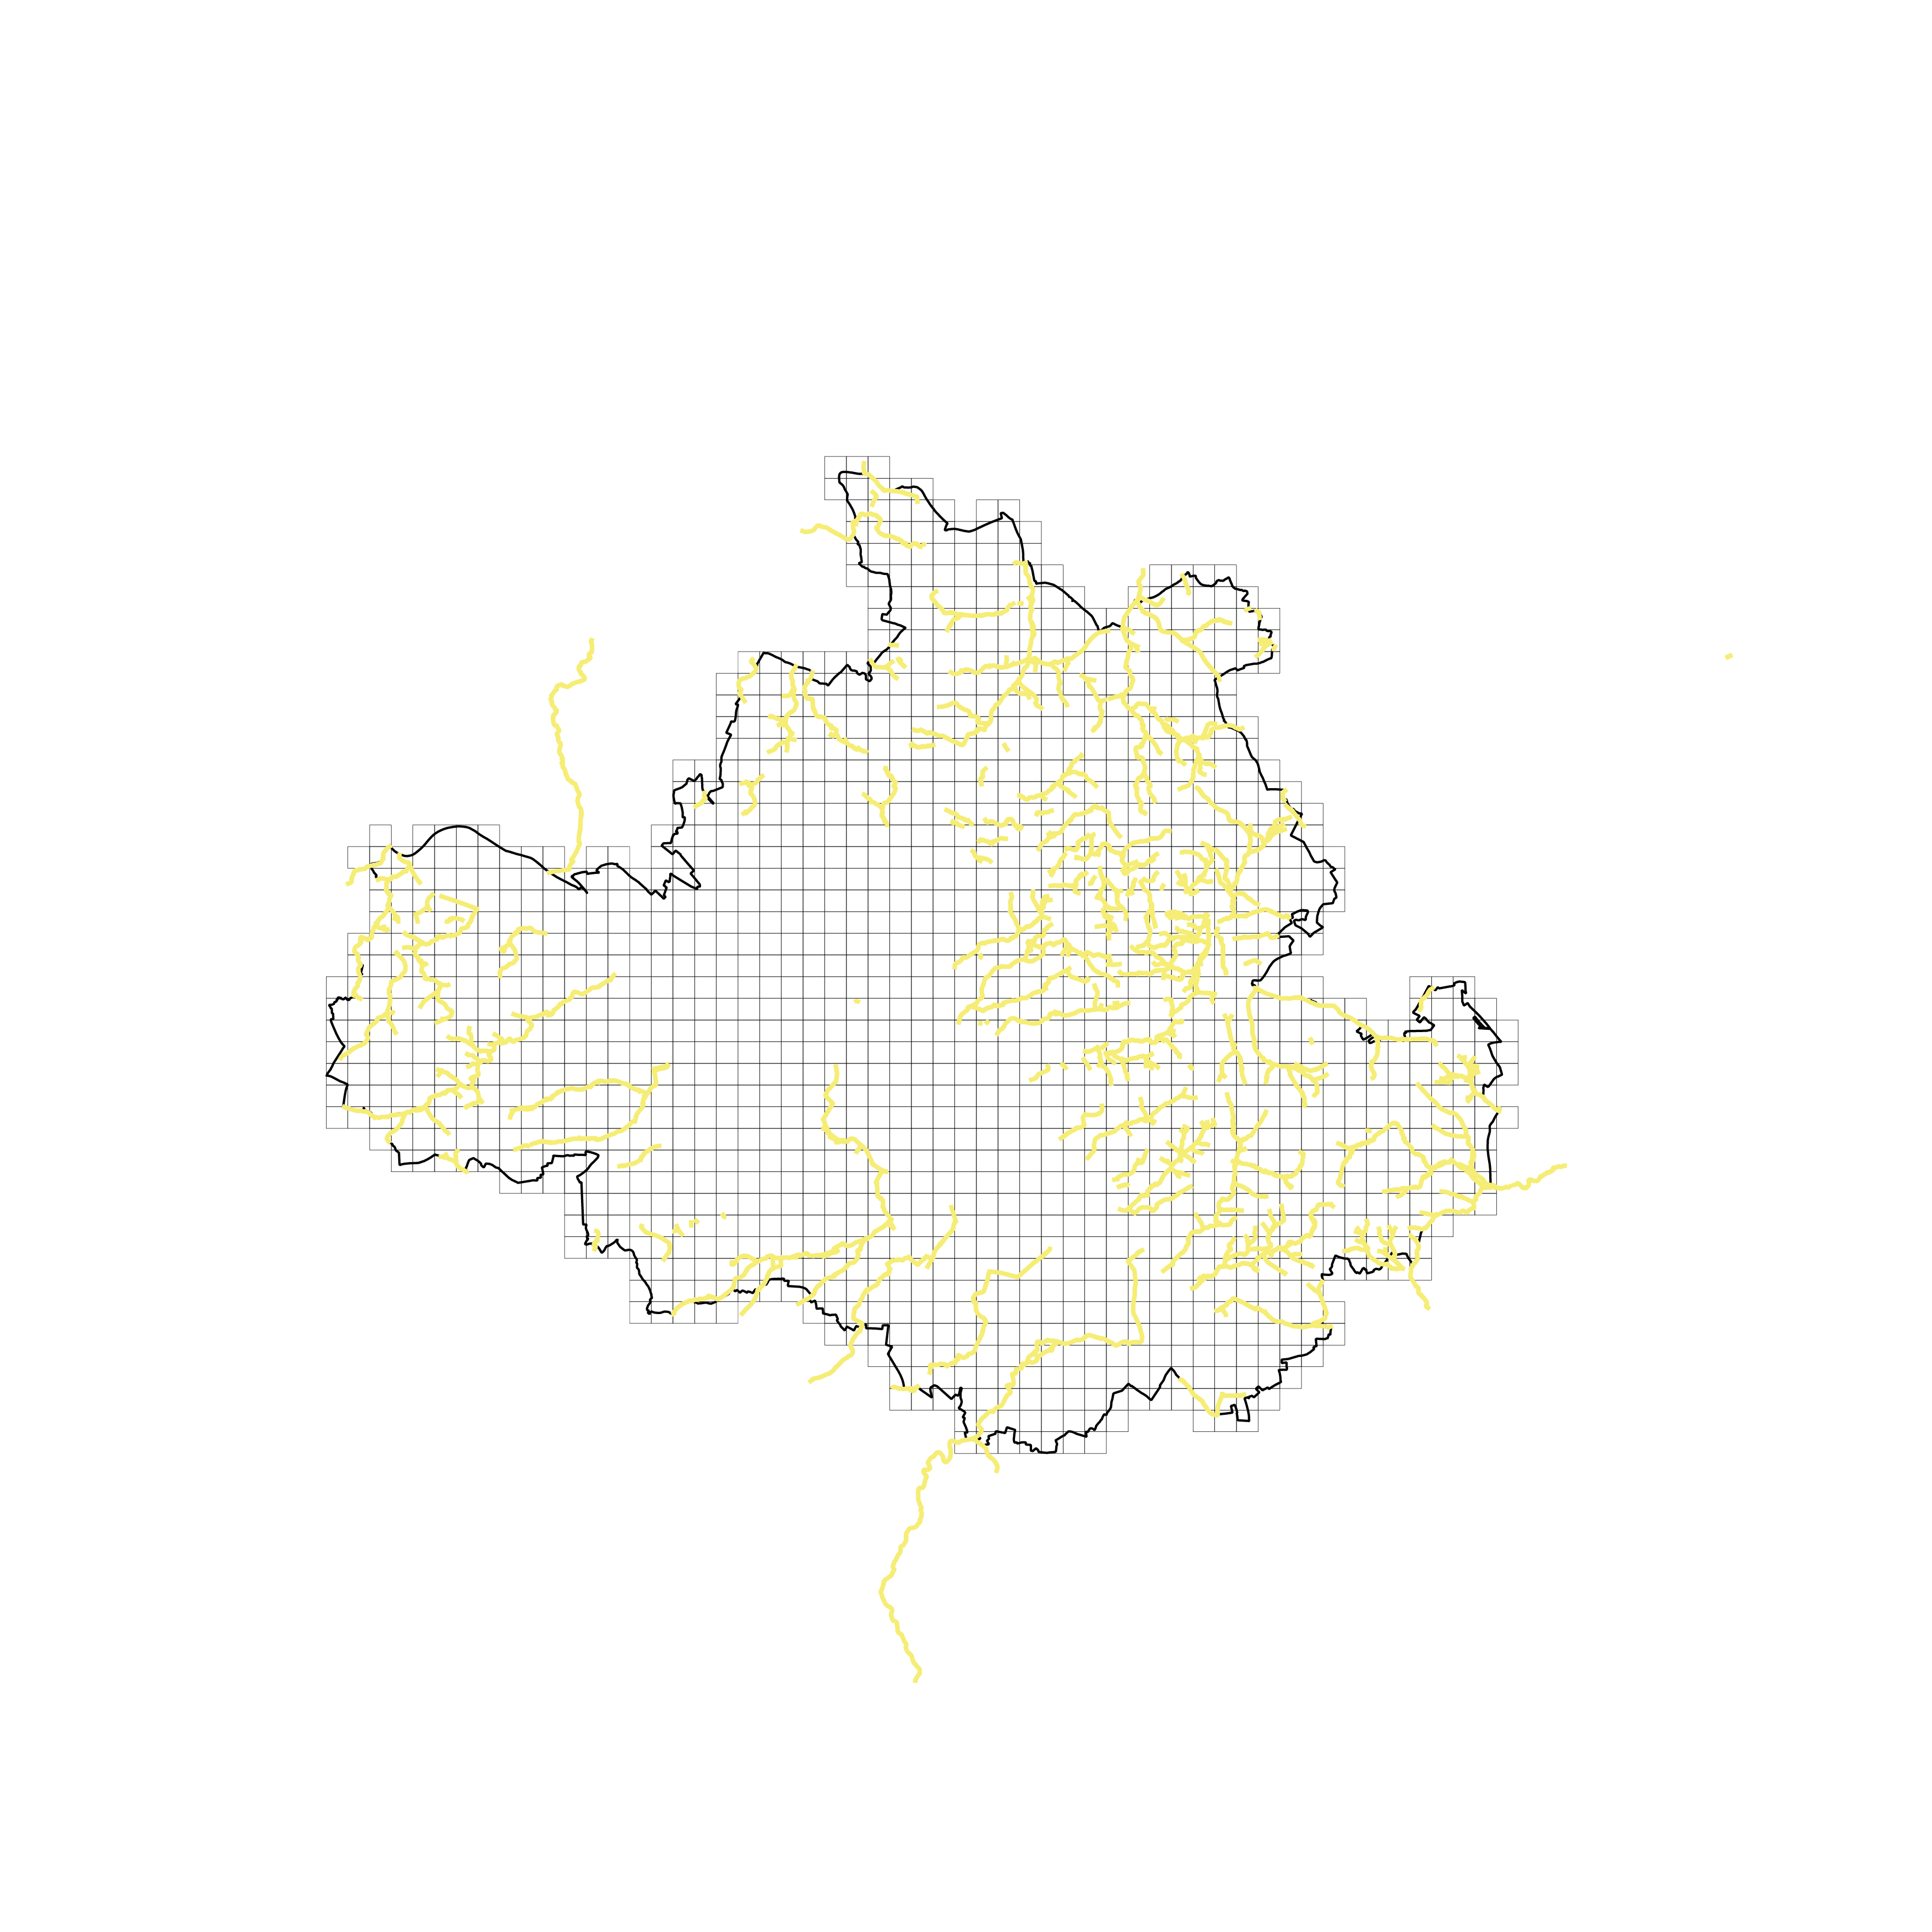
To establish a systematic analysis framework, we created a standardised spatial grid covering the entire city of Dresden. We chose a 500 by 500 meter grid cell size for three key reasons: (1) it represents a comfortable walkable distance for urban residents, (2) it provides sufficient granularity to capture local variations in stream conditions, and (3) it maintains computational efficiency for city-wide analysis. The site selection process followed these specific steps:
- We generated a regular grid covering the administrative boundary of Dresden using QGIS;
- We obtained the urban stream network from Dresden’s municipal open data portal (OpenDataPortal Dresden, 2025C);
- Using QGIS, we identified all grid cells that intersect at least one stream segment;
- Lastly, we filtered the grid dataset to only keep these cells containing streams.
This approach ensured our analysis focused exclusively on relevant areas while maintaining a consistent spatial unit for all subsequent analyses and comparisons.

2.2 MCDA
To combine the data and answer the main research question, a Multi-Criteria Decision Analysis (MCDA) is used as it can help quantify non-economic objectives, communicate trade-offs, facilitate consistent and explicit valuation, and focus negotiation on ultimate objectives (Corsair et al., 2009). This method includes several steps, which are described below.
Step 1: Data Collection and Grid Representation
Open-source datasets are collected and displayed on a fixed grid of 500-by-500-meter squares. Since the research focuses on finding which streams are most suitable for restoration, only the grid tiles that overlap with streams are shown in the results, as identified during the site selection process.
Step 2: Data Normalisation
Next, the data is normalised so that it can be compared. This starts by checking whether a dataset represents good or bad conditions for stream restoration. This is indicated with a plus (+) for good conditions to improve, or a minus (–) when improvement is less needed. For example, streams with lots of greenery already have lower restoration potential, so a dataset showing green areas is marked with a minus (–), and vice versa. For each layer we converted our analysis results into a scale of 0-1, with 0 being the worst performing, and thus the most suitable for urban stream restoration and 1 being the best performing. In the results section, for each individual layer, we outline how we reached this 0-1 scale.
Step 3: Weighting the Layers
In this step, the different data layers are given weights based on their importance. Since this step involves some subjectivity, the literature study helps to support the choices made. The Analytic Hierarchy Process (AHP) is used to compare each dataset in a matrix, assigning weights based on their relevance to each other. To keep the process clear, data layers are only compared within their topic area: climate adaptation, quality of life, or biodiversity.
Step 4: Combining the Results Lastly, the three individual weighted layers are combined, resulting in a single overall weighted map. This map shows which grid tiles, overall, perform the best and worst.
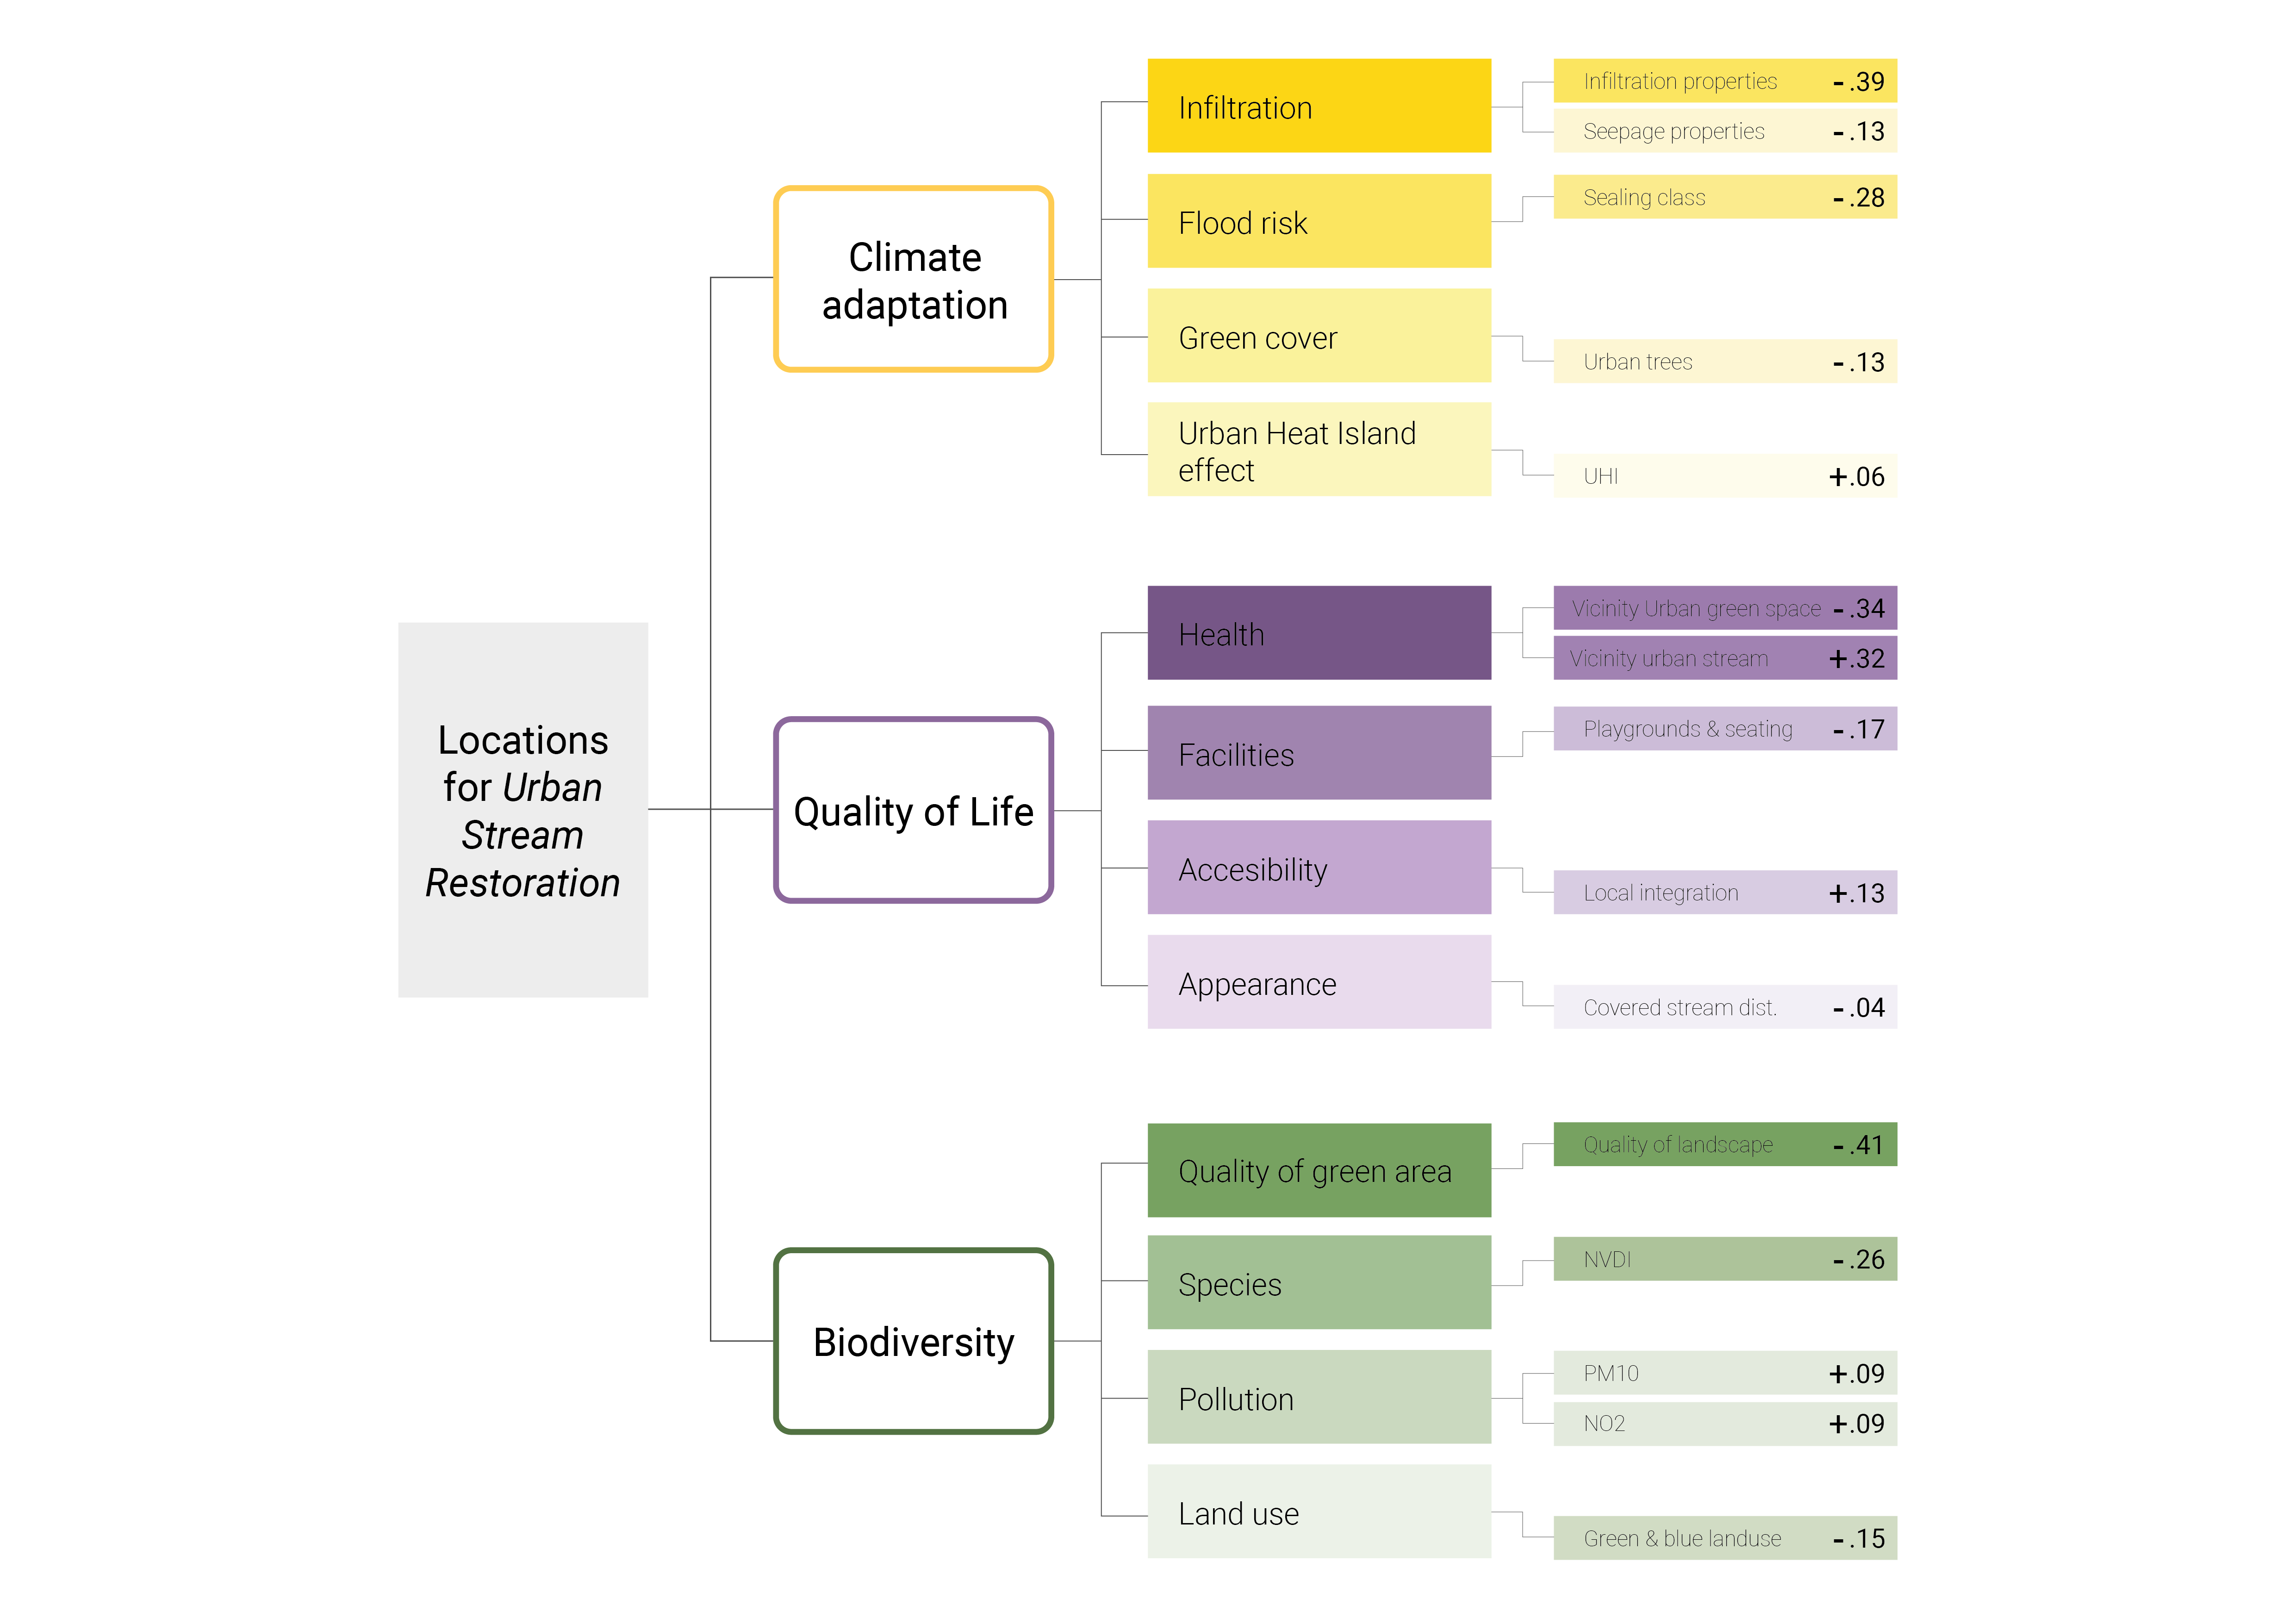
The structure of our full MCDA process, including our weights, our minimisation/maximisation goals, is summarised in the figure below. Further we’ll discuss how we came to this overall structure and the individual elements.
2.3 Typology Construction
Further, the project uses the Typology Construction method to systematically cluster urban streams based on similar characteristics in terms of their normalised scores obtained during the data collection in the MCDA. This cluster definition helps in creating a tool-kit for urban stream restoration, which can include combinations of design and policy measures that can be applied within each cluster. It can help reduce the complexity of urban stream networks by clustering them into manageable groups, which helps optimise budgeting, planning, and monitoring. This method includes several steps, which are described below.
Step 1. Categories for creating clusters
The streams are categorised into typologies based on the 15 sub-categories outlined and normalised in the S-MCDA method. For instance, streams with high sealing class, moderate infiltration, and medium biodiversity may form a distinct class.
Step 2. Choosing the clustering method
The K-means clustering method is used to identify coherent groups. Within this, a comparison between the elbow method and silhouette scores is utilised to identify the optimum number of clusters with which the project should proceed. The silhouette-based clustering is considered as it ensures that each resulting stream type is distinct enough to justify a specific restoration strategy. This is important for compliance with the EU Water Framework Directive, which emphasises tailored, type-specific measures (Deutsch et al., 2014). Following this process, the resultant ideal number of clusters is 3.
Step 3. Priority selection
The cluster that corresponds with the worst-performing tiles in the overall weighted MCDA map is the urban streams in need of immediate restoration measures. The streams nearest to each cluster centroid are the most typical or “prototypical” examples of that stream type. These can serve as reference sites for understanding restoration needs or developing management templates.
Step 4. Propose design measures
Addressing the specific characteristics of the prototypical examples as a starting point in the case of the worst-performing tiles with design measures that can facilitate the urban stream restoration project at that site, also serving as a pilot case for the other similar stretches of the urban streams in the same cluster.
2.4 Reproducibility self-assessment
We have tried to design our project and workflow with a strong emphasis on reproducible research. For example, we’ve documented to the best of our abilities our processing steps and full data workflow/pipeline, as documented in this report. With some steps, like the NDVI-analysis and the Topology maps obtained via (open-source) code. Reproducibility is also made easier by our exclusive use of open-source tools, e.g. R, RStudio, Python, QGIS, in combination with our exclusive use of publicly (and free) available datasets, like those from the municipality of Dresden, OSM and Copernicus. Additionally, we’ve included a readme for our project, and a separate readme specifically for our datasets, which we also included in our data publication on 4TU.
However, keeping the above in mind, specifically our emphasis on data processing documentation; We’ve mainly relied on QGIS for our spatial analysis. Which also means that our exact steps, (spatial) operations, etc. are not mapped (including history/version control) and are not explicitly scripted/fully documented, which may pose challenges for exactly reproducing what we did.
3 Results
3.1 Quality of Life
Urban streams exert an influence on the social level. The presence of an urban stream can directly influence the quality of life for the surrounding inhabitants of the area through creating a sense of community (Riley, 2016) or it can improve their general health. In order to assess the quality of life, this research focuses on the improvements the urban stream restoration project can provide on a day-to-day basis.
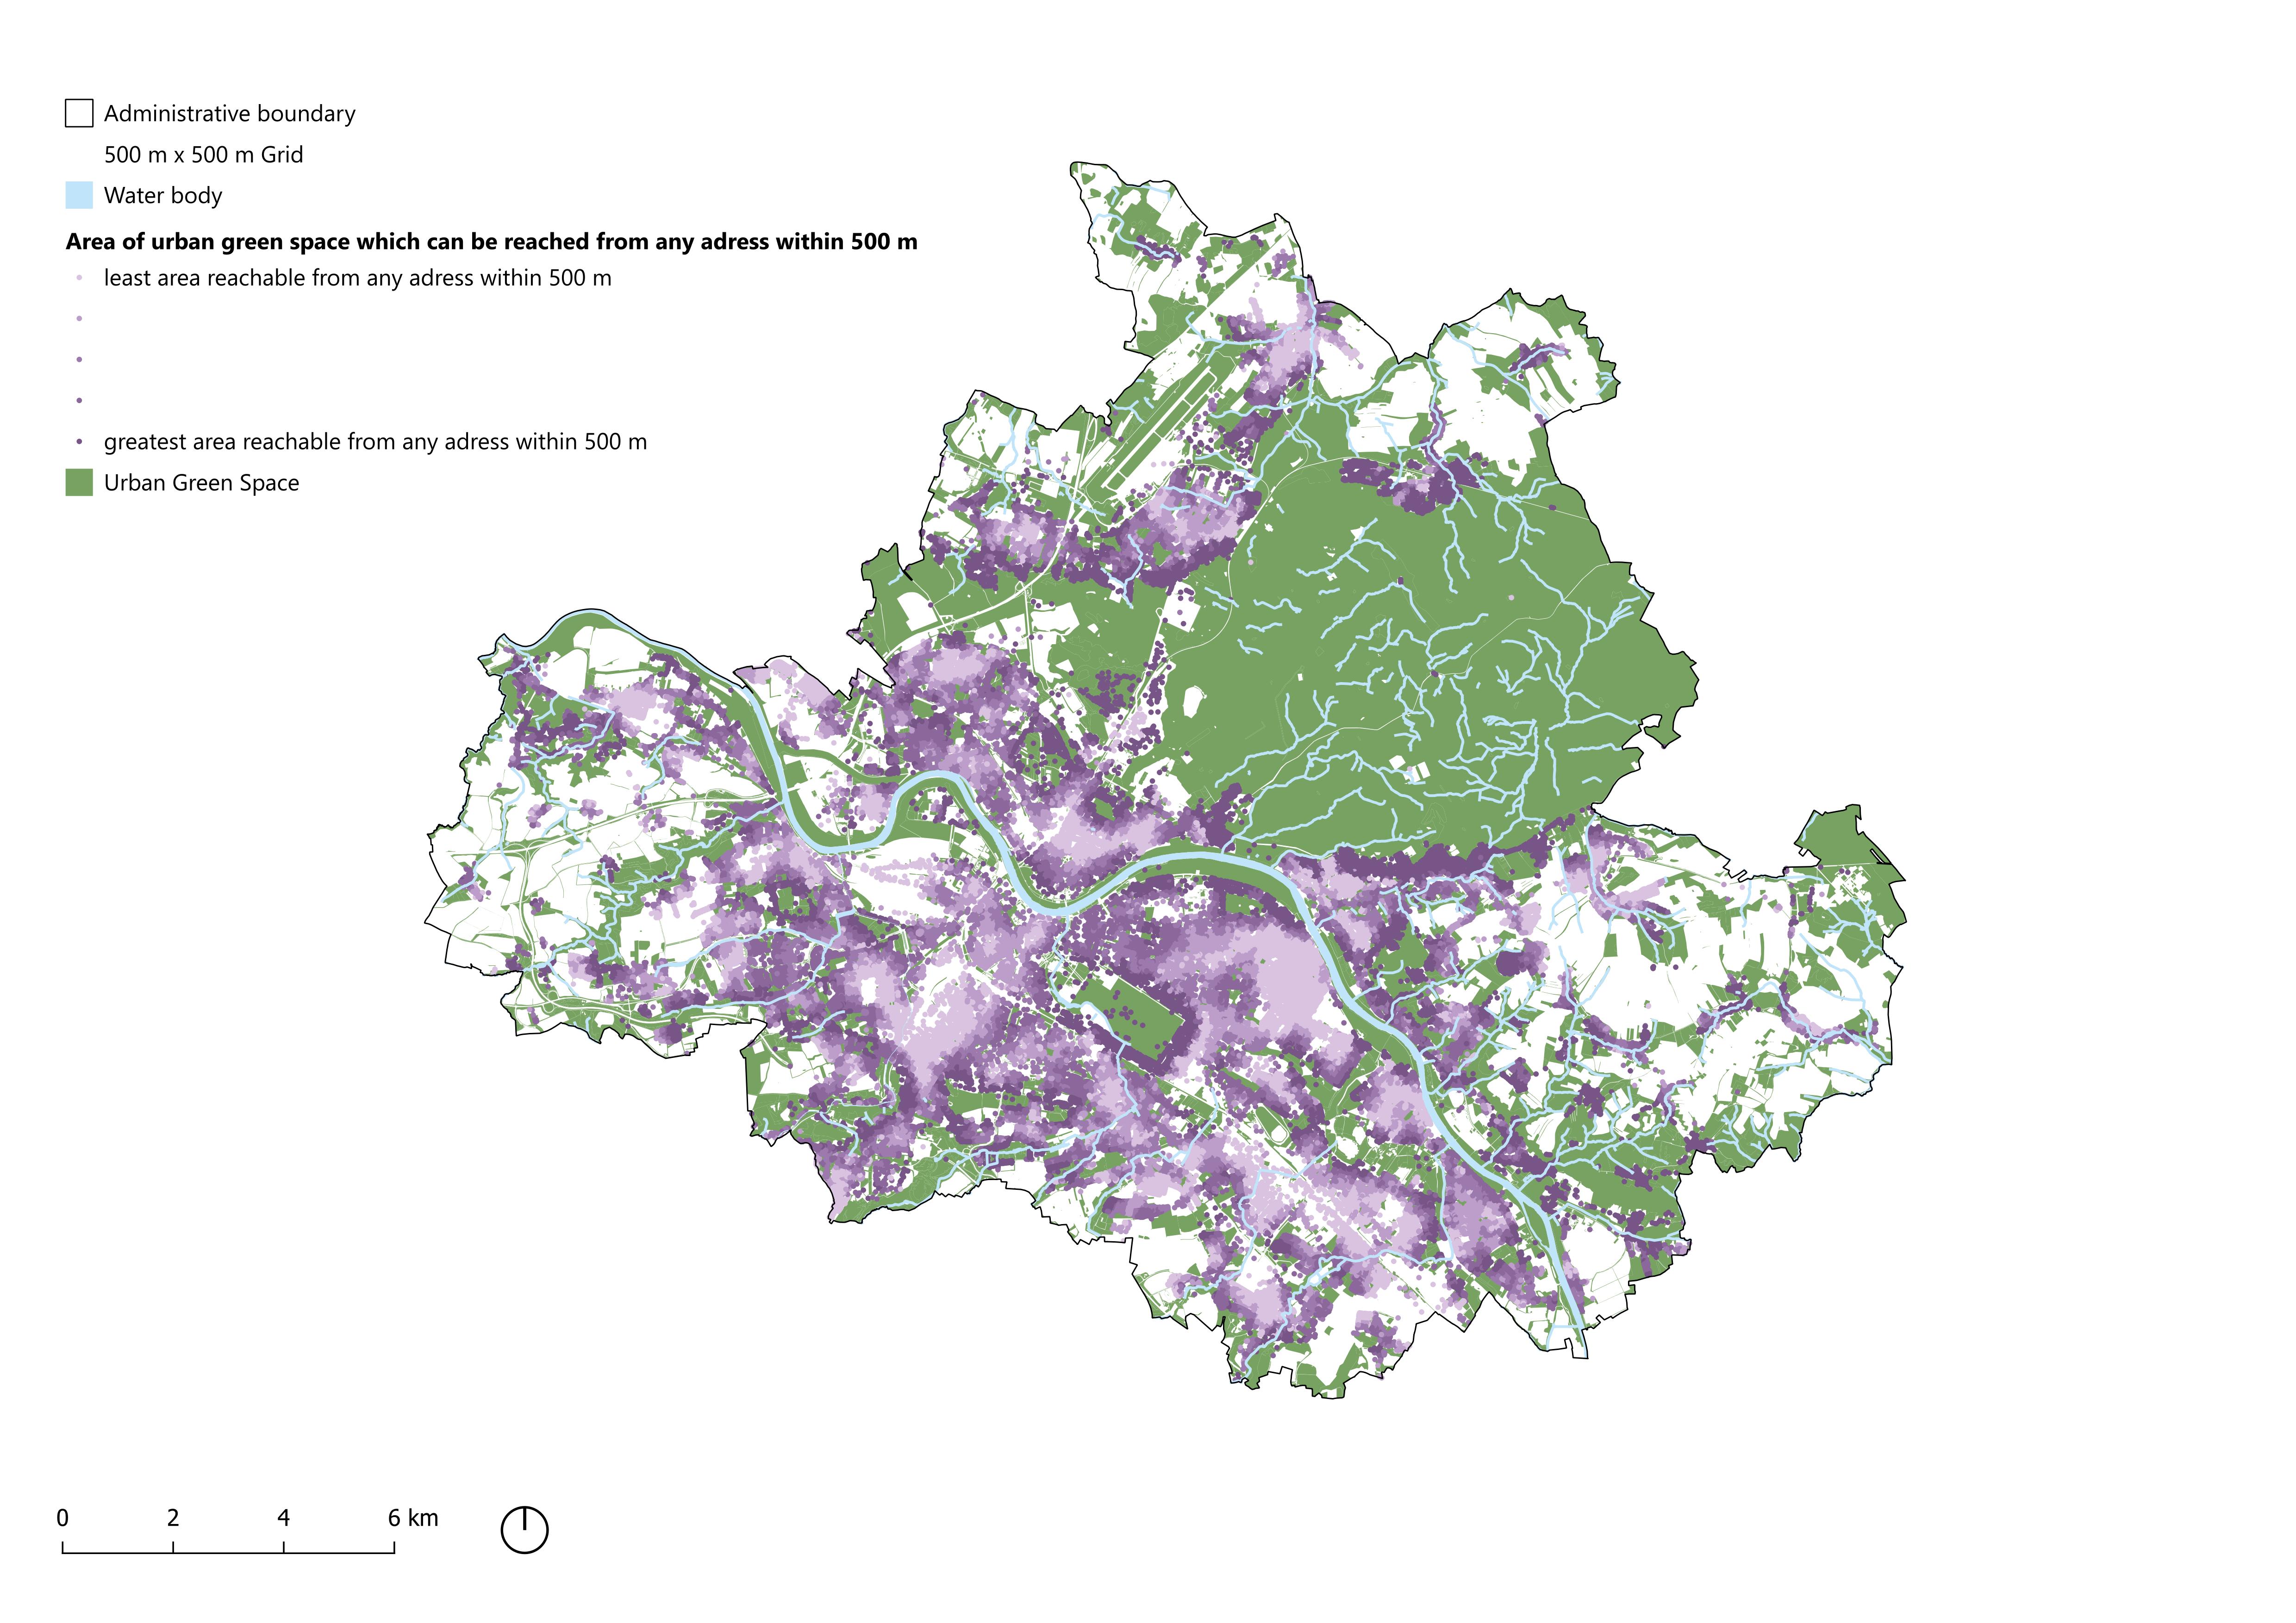
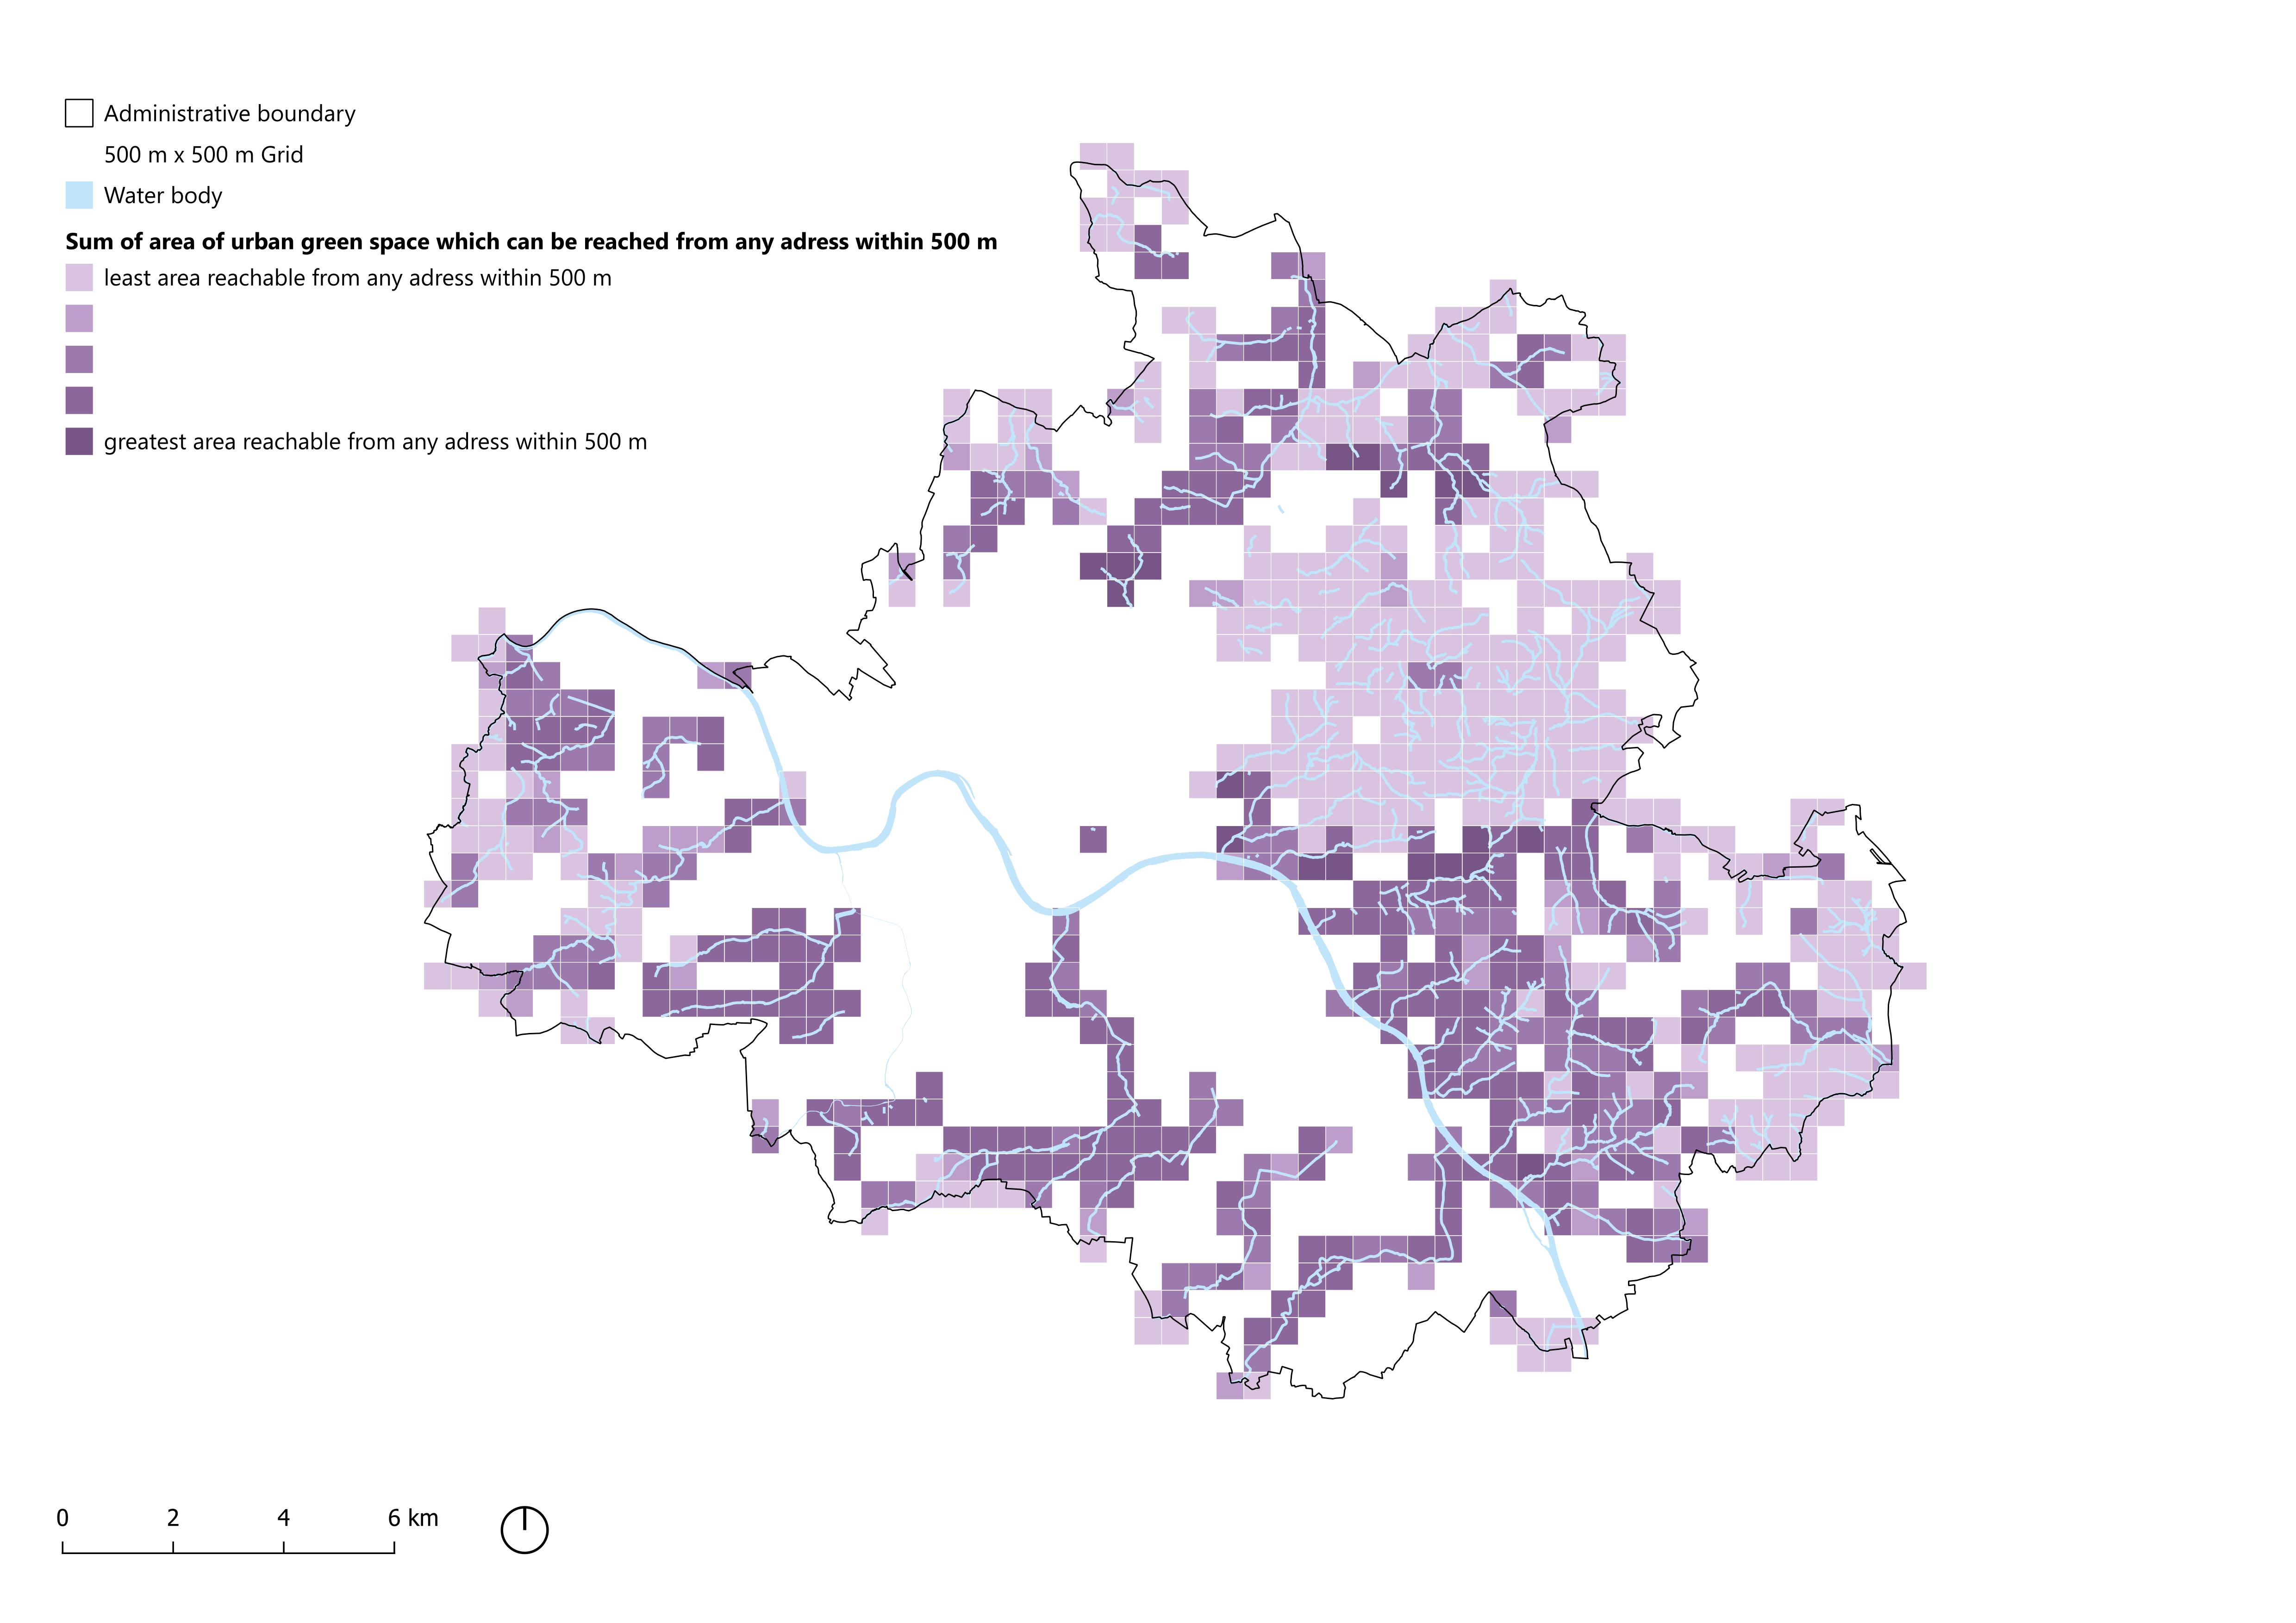
3.1.1 Vicinity to Urban Green Space
Many studies have shown urban green space to contribute to improved physical and mental health (Hartig et al., 2014; Dadvand & Nieuwenhuijsen, 2018; Gascon et al., 2015) by enhancing air quality, encouraging physical activity, reducing stress, and strengthening social cohesion, to name a few examples. However, to carry out the necessary analysis for the city of Dresden, a scientific basis is required in order to determine what variables to consider. A study conducted in the Turkish city of Aydın examined the relationship between the availability of urban green space and the physical and mental health of citizens in urbanised areas (Akpinar, 2016). A higher frequency of physical activity was reported by those citizens who live closer to urban green spaces. This increased activity is associated with better mental health and reduced stress levels. Furthermore, the study showed that larger and more open green spaces further encourage physical activity, indicating that not only the presence but also the size of green areas should be taken into account.
This analysis was conducted by using the Attraction Reach module of the Place Syntax Tool with a radius of 500 metres. The distance of 500 metres was chosen as this is indicative of the walkability of a neighbourhood (Van Nes, 2021). The origins consist of all addresses in the city of Dresden (OpenDataPortal Dresden, 2025A), while destinations include all green spaces within the city boundaries, as provided by OpenStreetMap. The results of the Attraction Reach analysis were adjusted for the area of urban green space, as calculated with the QGIS Field Calculator using $area. This returned a value depicting the total area of urban green space which can be reached from any given address.
These values were then aggregated within grid cells. The decision to analyse by address, rather than by building, was made to better account for grid cells with higher address densities, which may not have been accurately represented by building-level data alone. To normalise the grid values, the summed accessible area per address was divided by the highest value, resulting in a scale from 0 to 1. Since the distribution of these values was skewed, with most values falling below 0.1, a logarithmic transformation was applied to achieve a more balanced distribution.
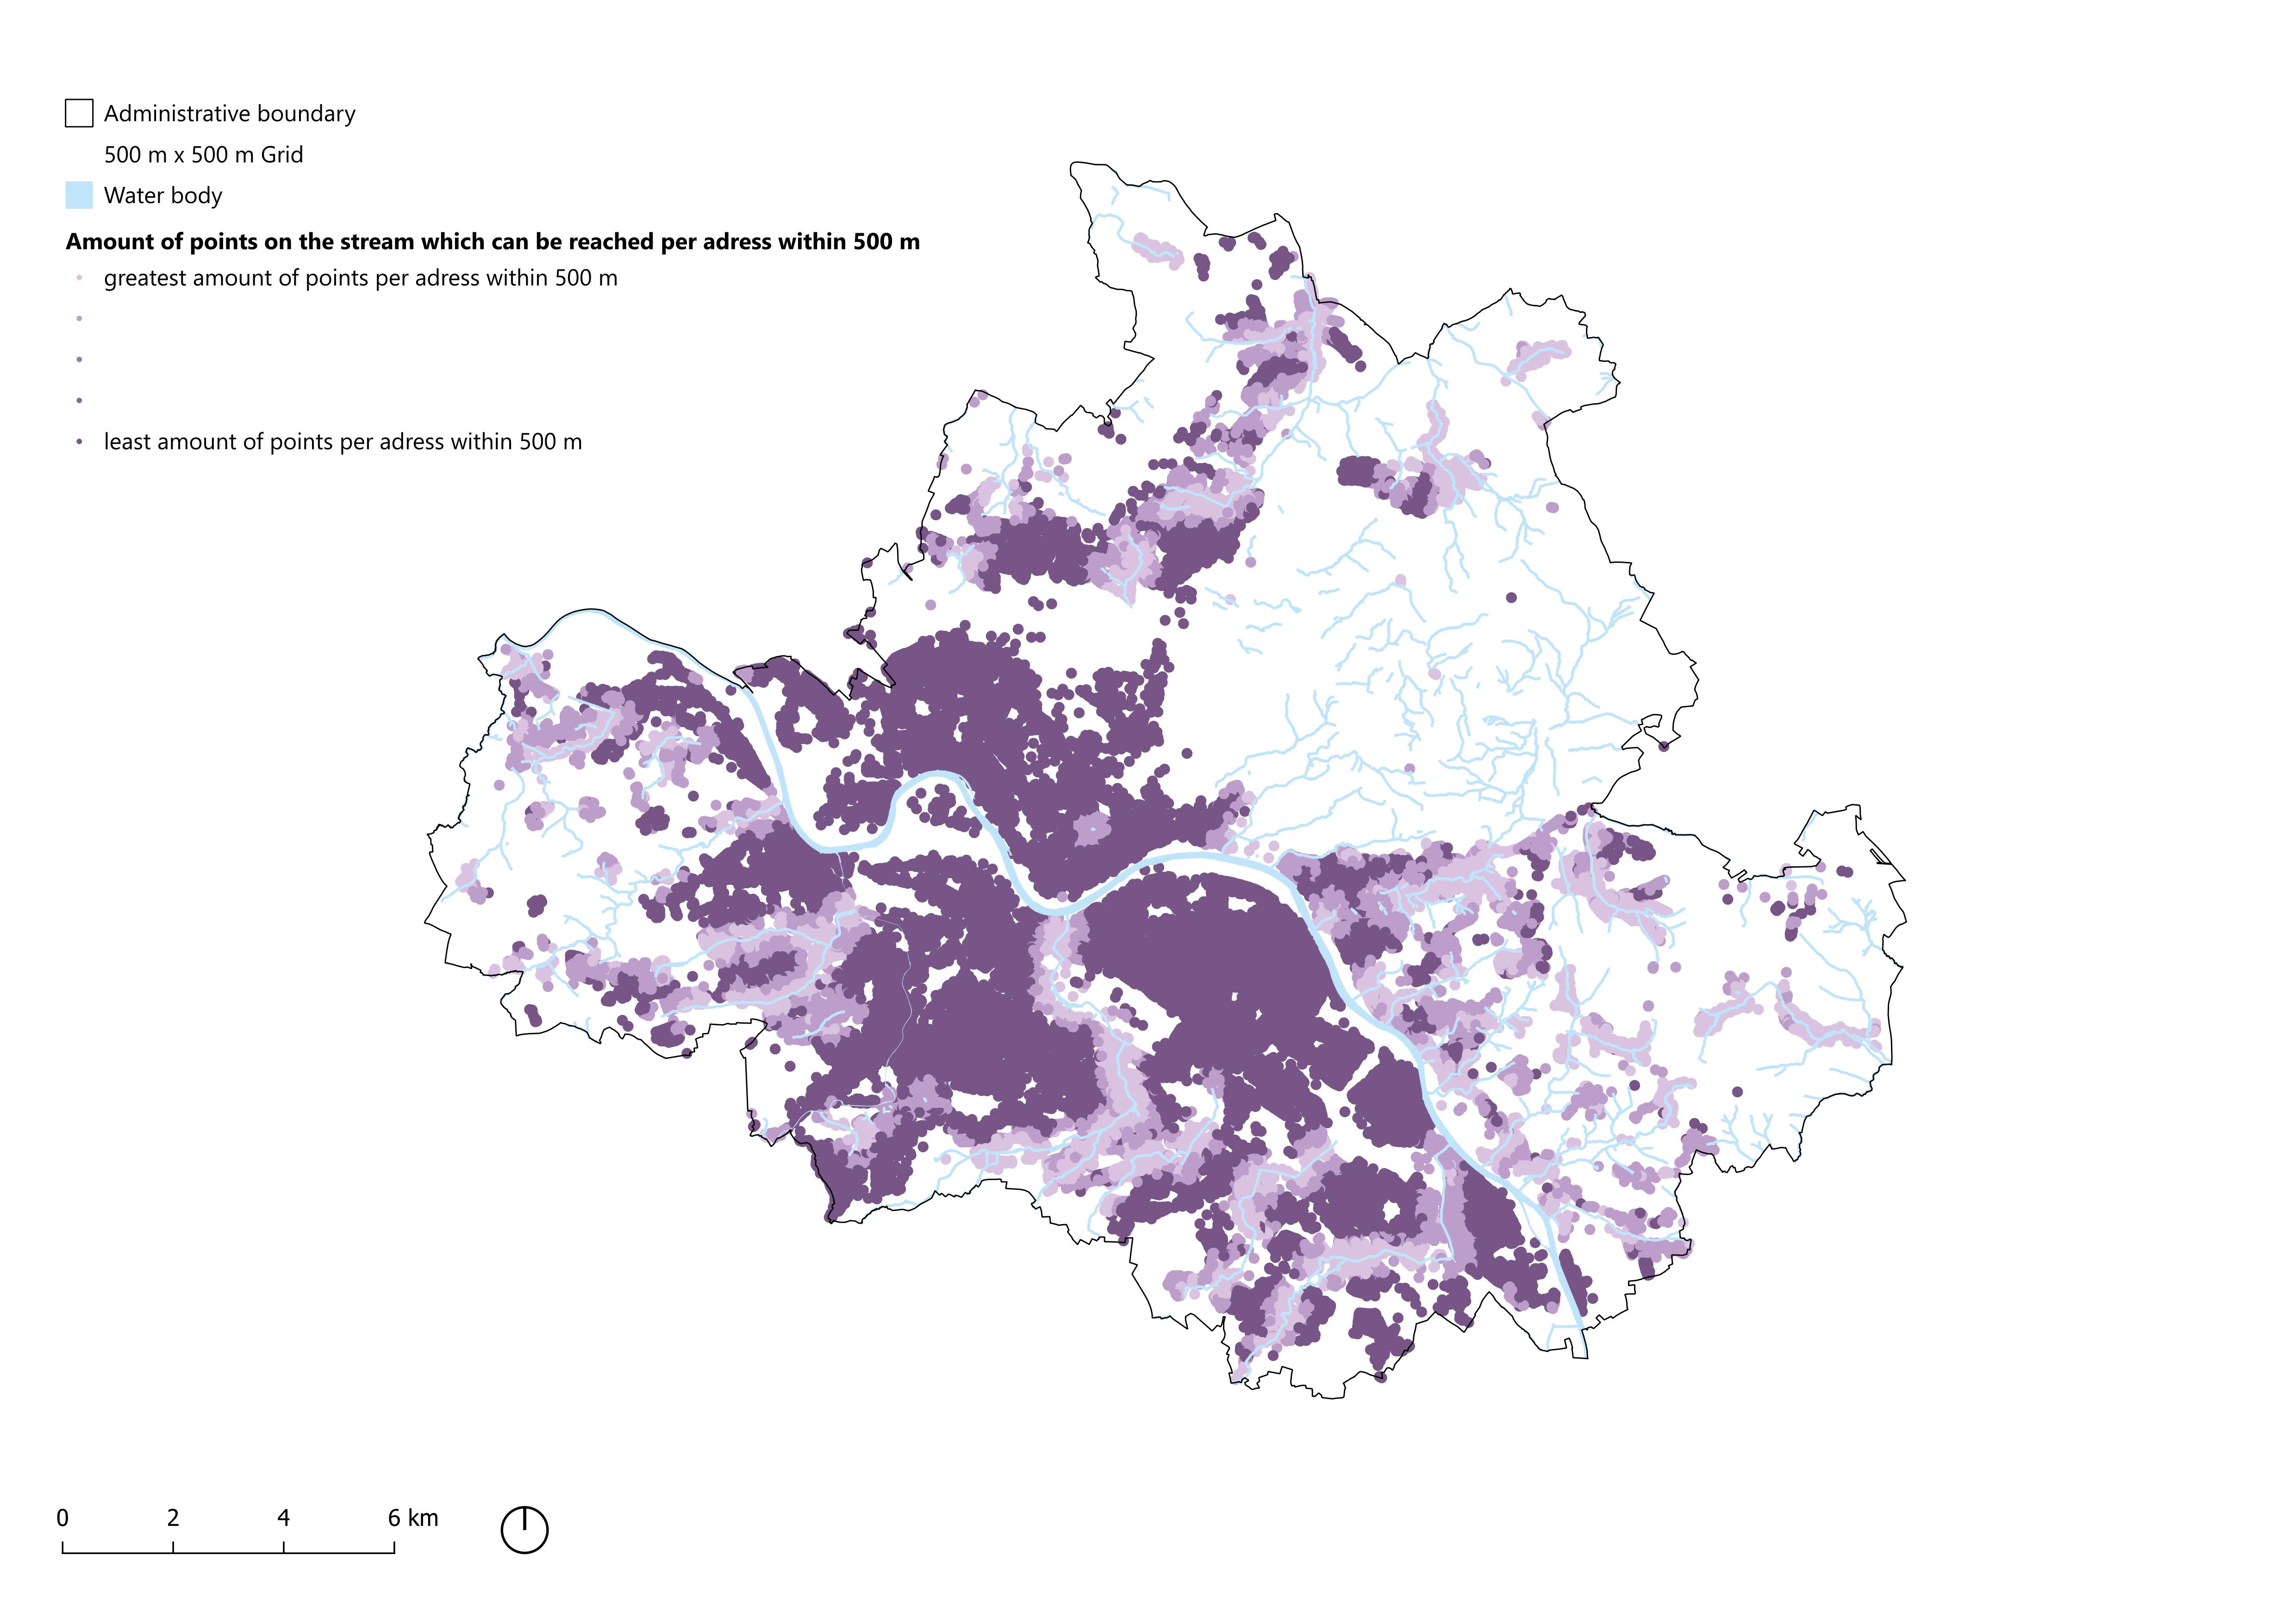
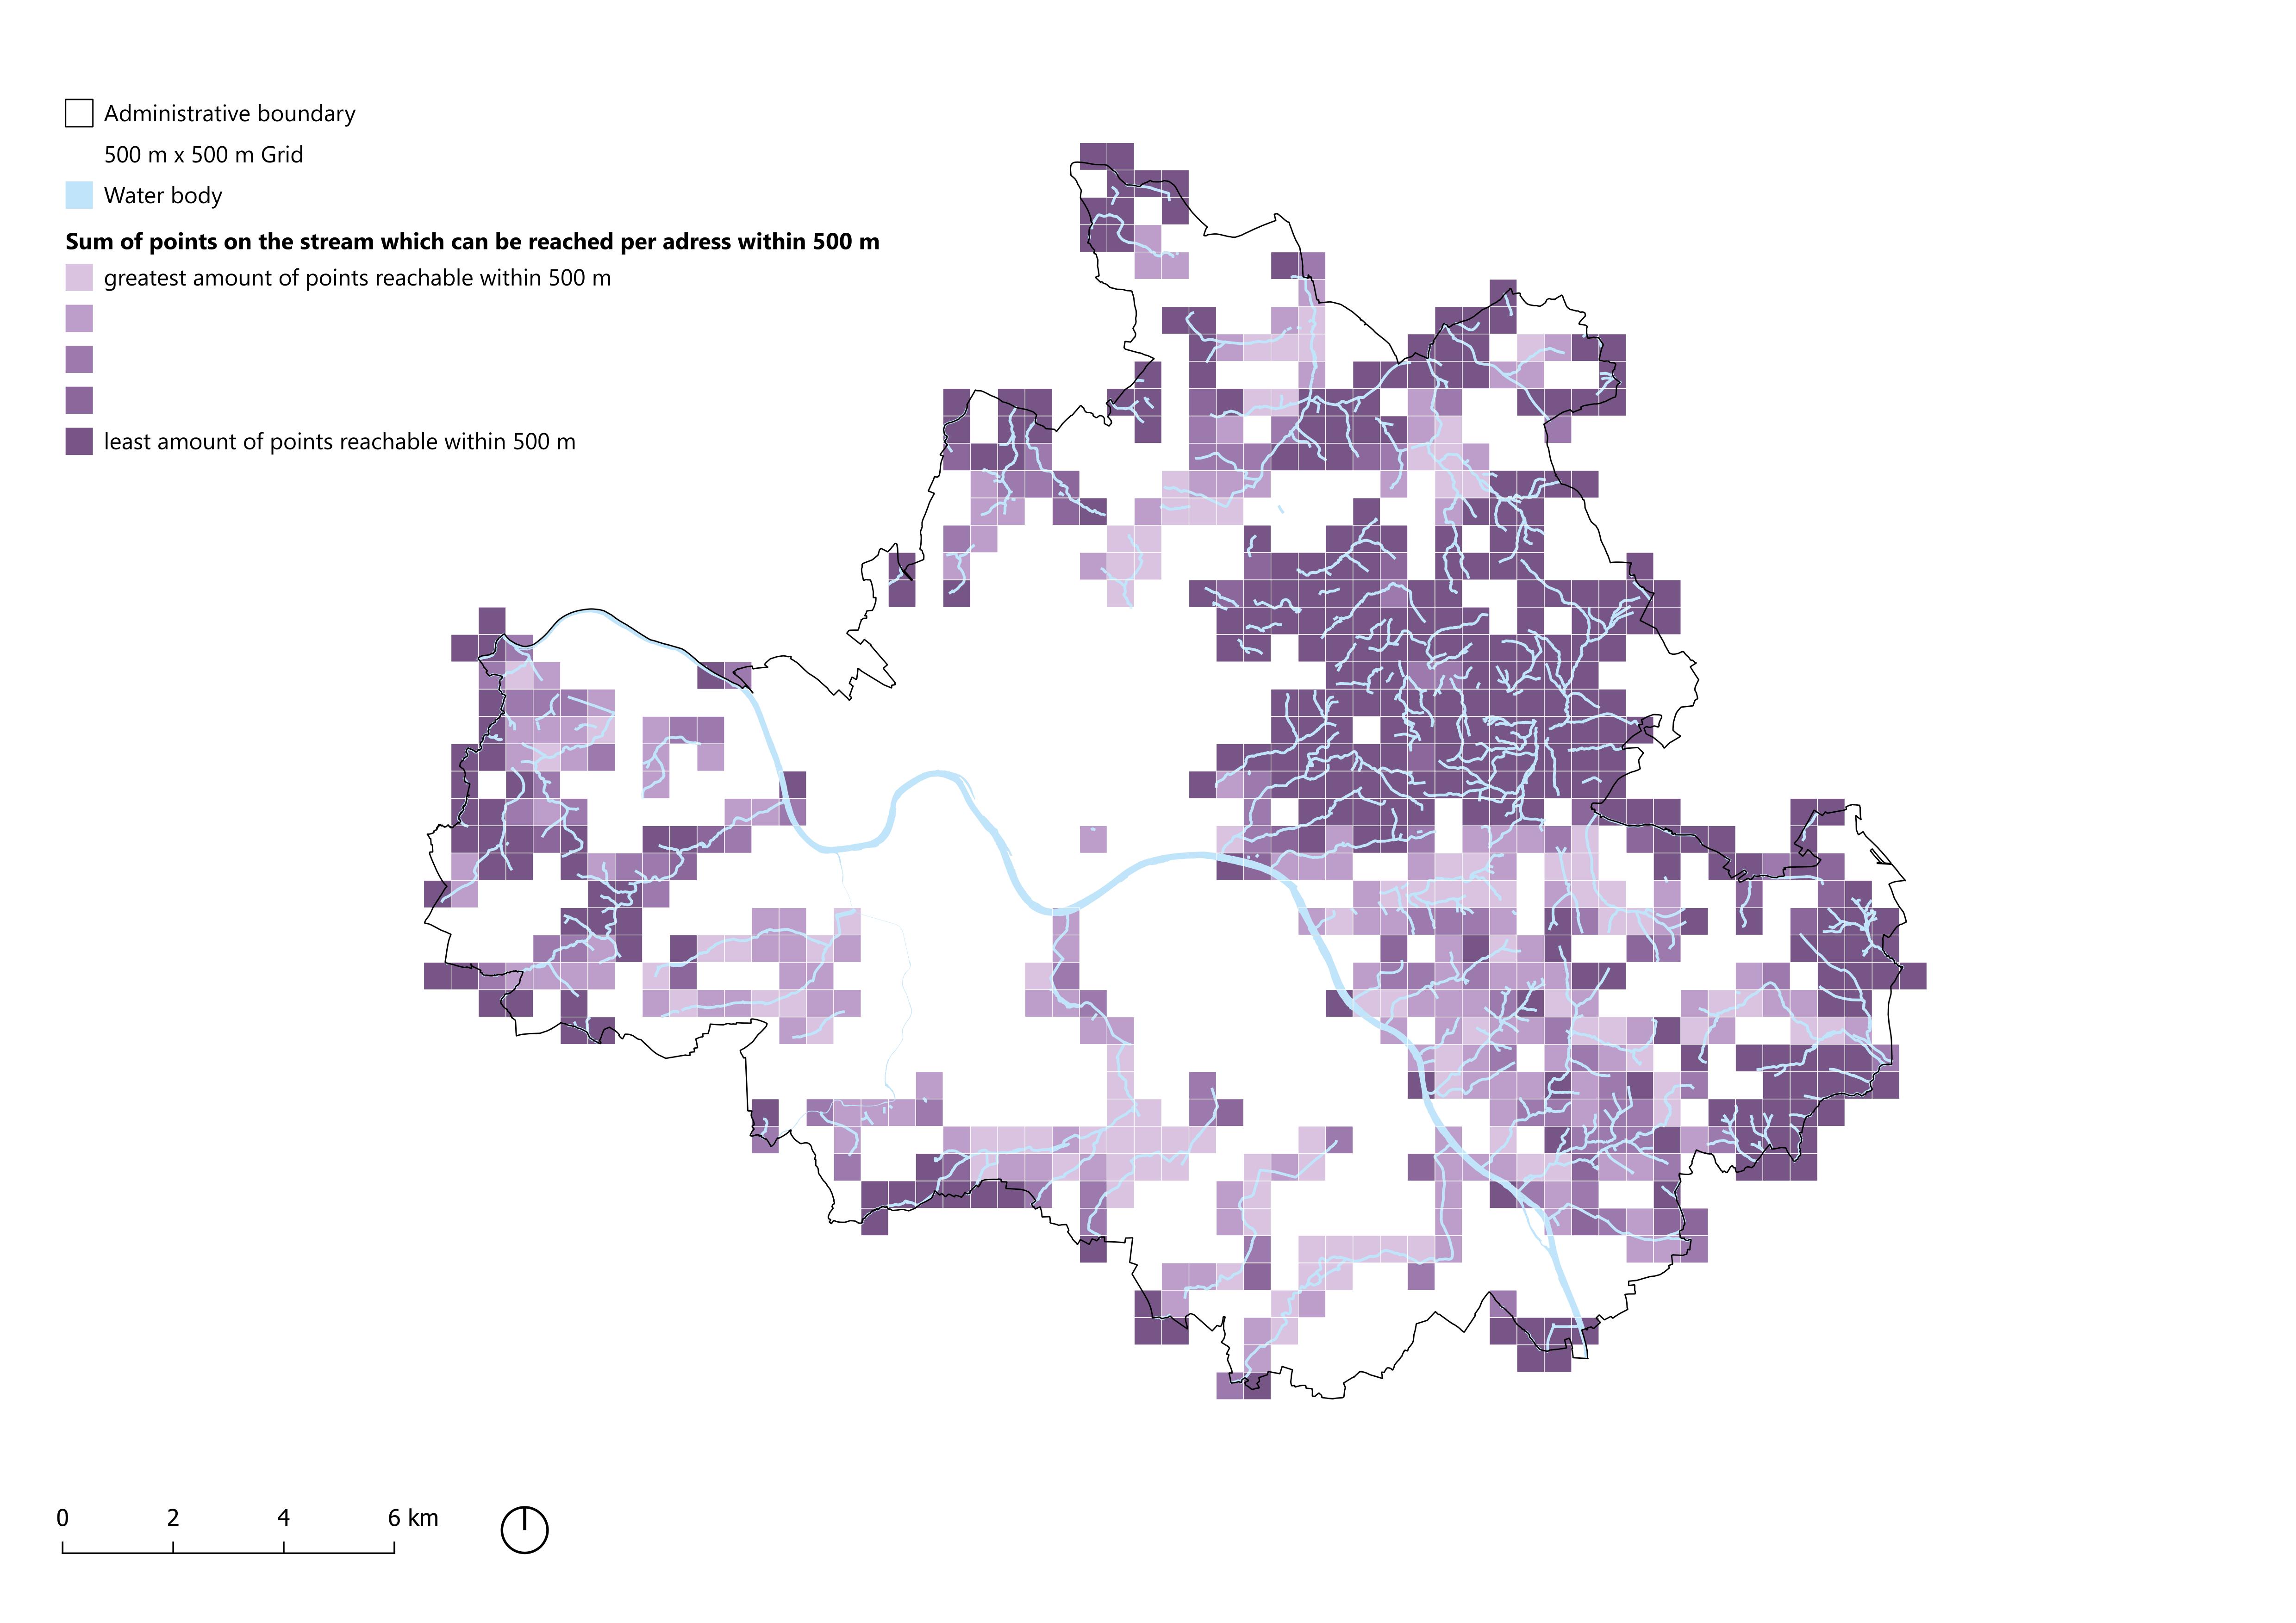
3.1.2 Vicinity to Streams
Besides the availability of urban green space, the presence of urban blue space also provides a positive impact on general health. When individuals perceive that urban blue space is reachable within walking distance from their home, they report better mental and physical well-being (Völker, 2018). While this study focuses on the home environment and thus residential neighbourhoods, another study investigated the effect of blue space in work environments. Vert et al. (2020) demonstrated the positive effect of blue space on mental health through conducting an experiment in which subjects were assigned to spend 20 minutes at a selected environment. They either walked through blue or urban space or rested at a control site. In this study, general improvements in well-being and mood were found after walking through blue space.
This analysis was conducted by using the Attraction Reach module of the Place Syntax Tool with a radius of 500 metres. The distance of 500 metres was chosen as this is indicative of the walkability of a neighbourhood (Van Nes, 2021). The origins consist of all addresses in the city of Dresden (OpenDataPortal Dresden, 2025A) while destinations were determined through placing a point for every 50 meters along the stream.
These values were then aggregated within grid cells. The decision to analyse by address, rather than by building, was made to better account for grid cells with higher address densities, which may not have been accurately represented by building-level data alone. To normalise the grid values, the summed accessible area per address was divided by the highest value, resulting in a scale from 0 to 1. Since the distribution of these values was skewed, with most values falling below 0.1, a logarithmic transformation was applied to achieve a more balanced distribution.
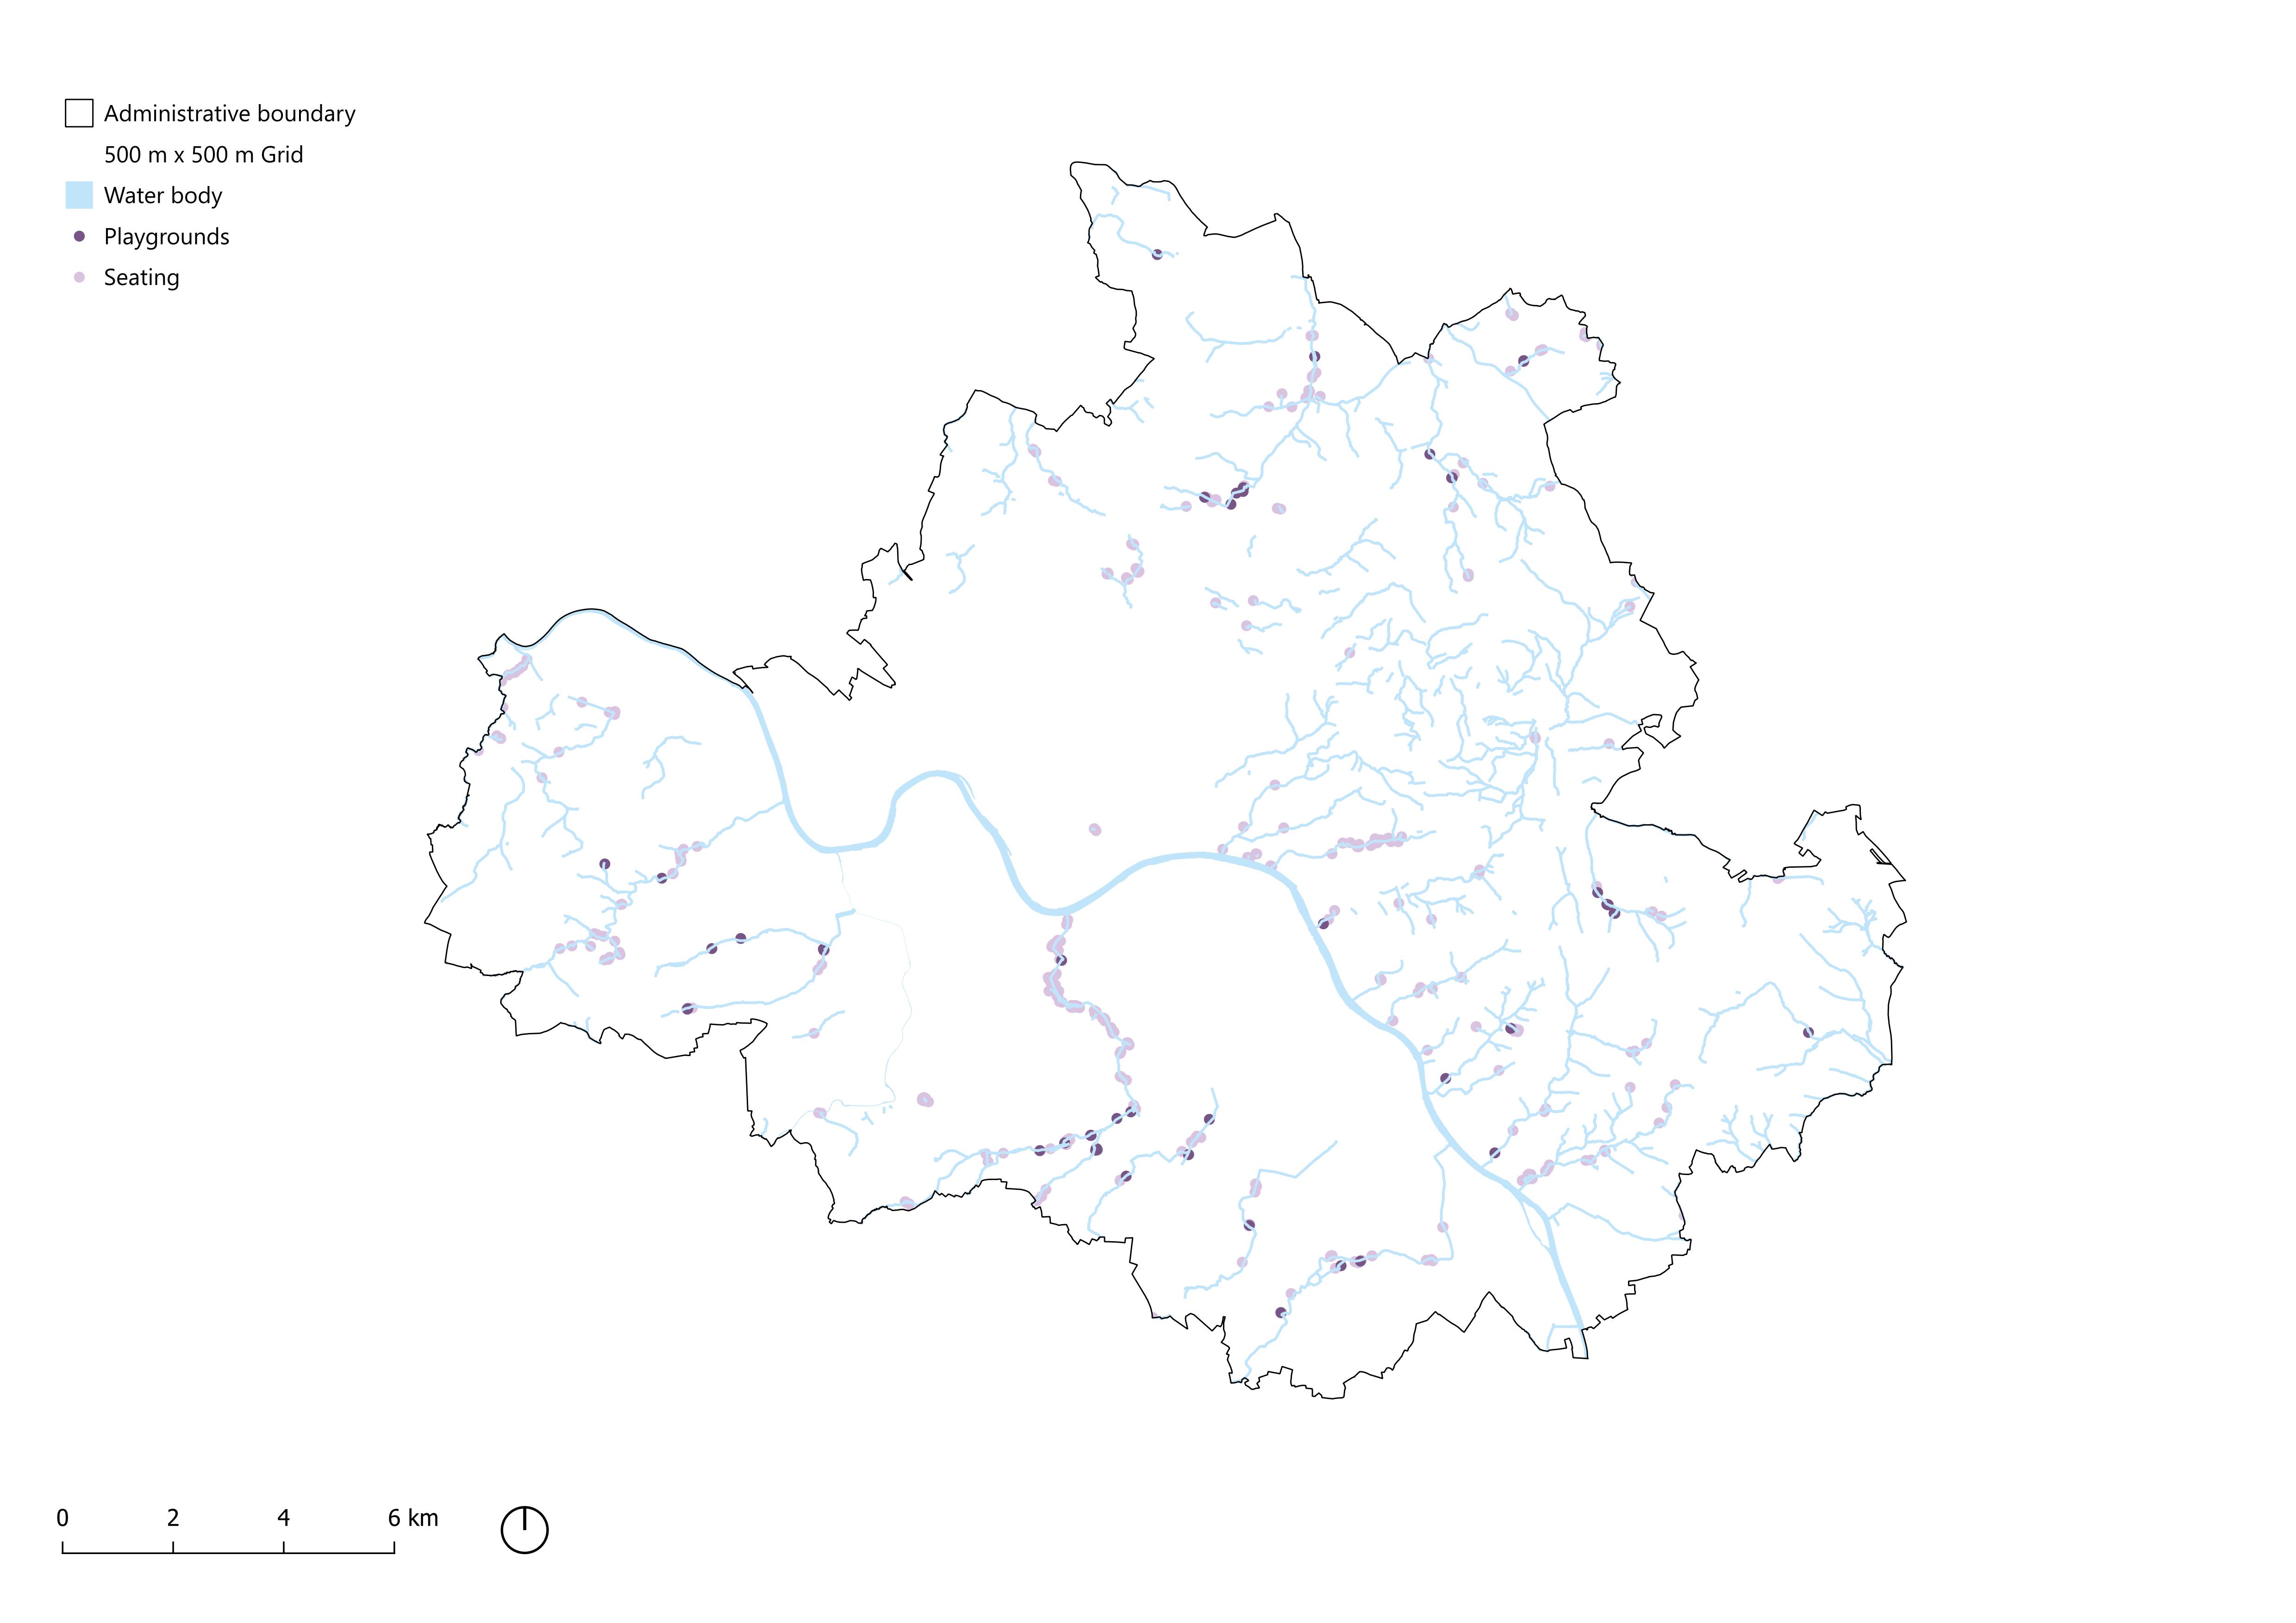
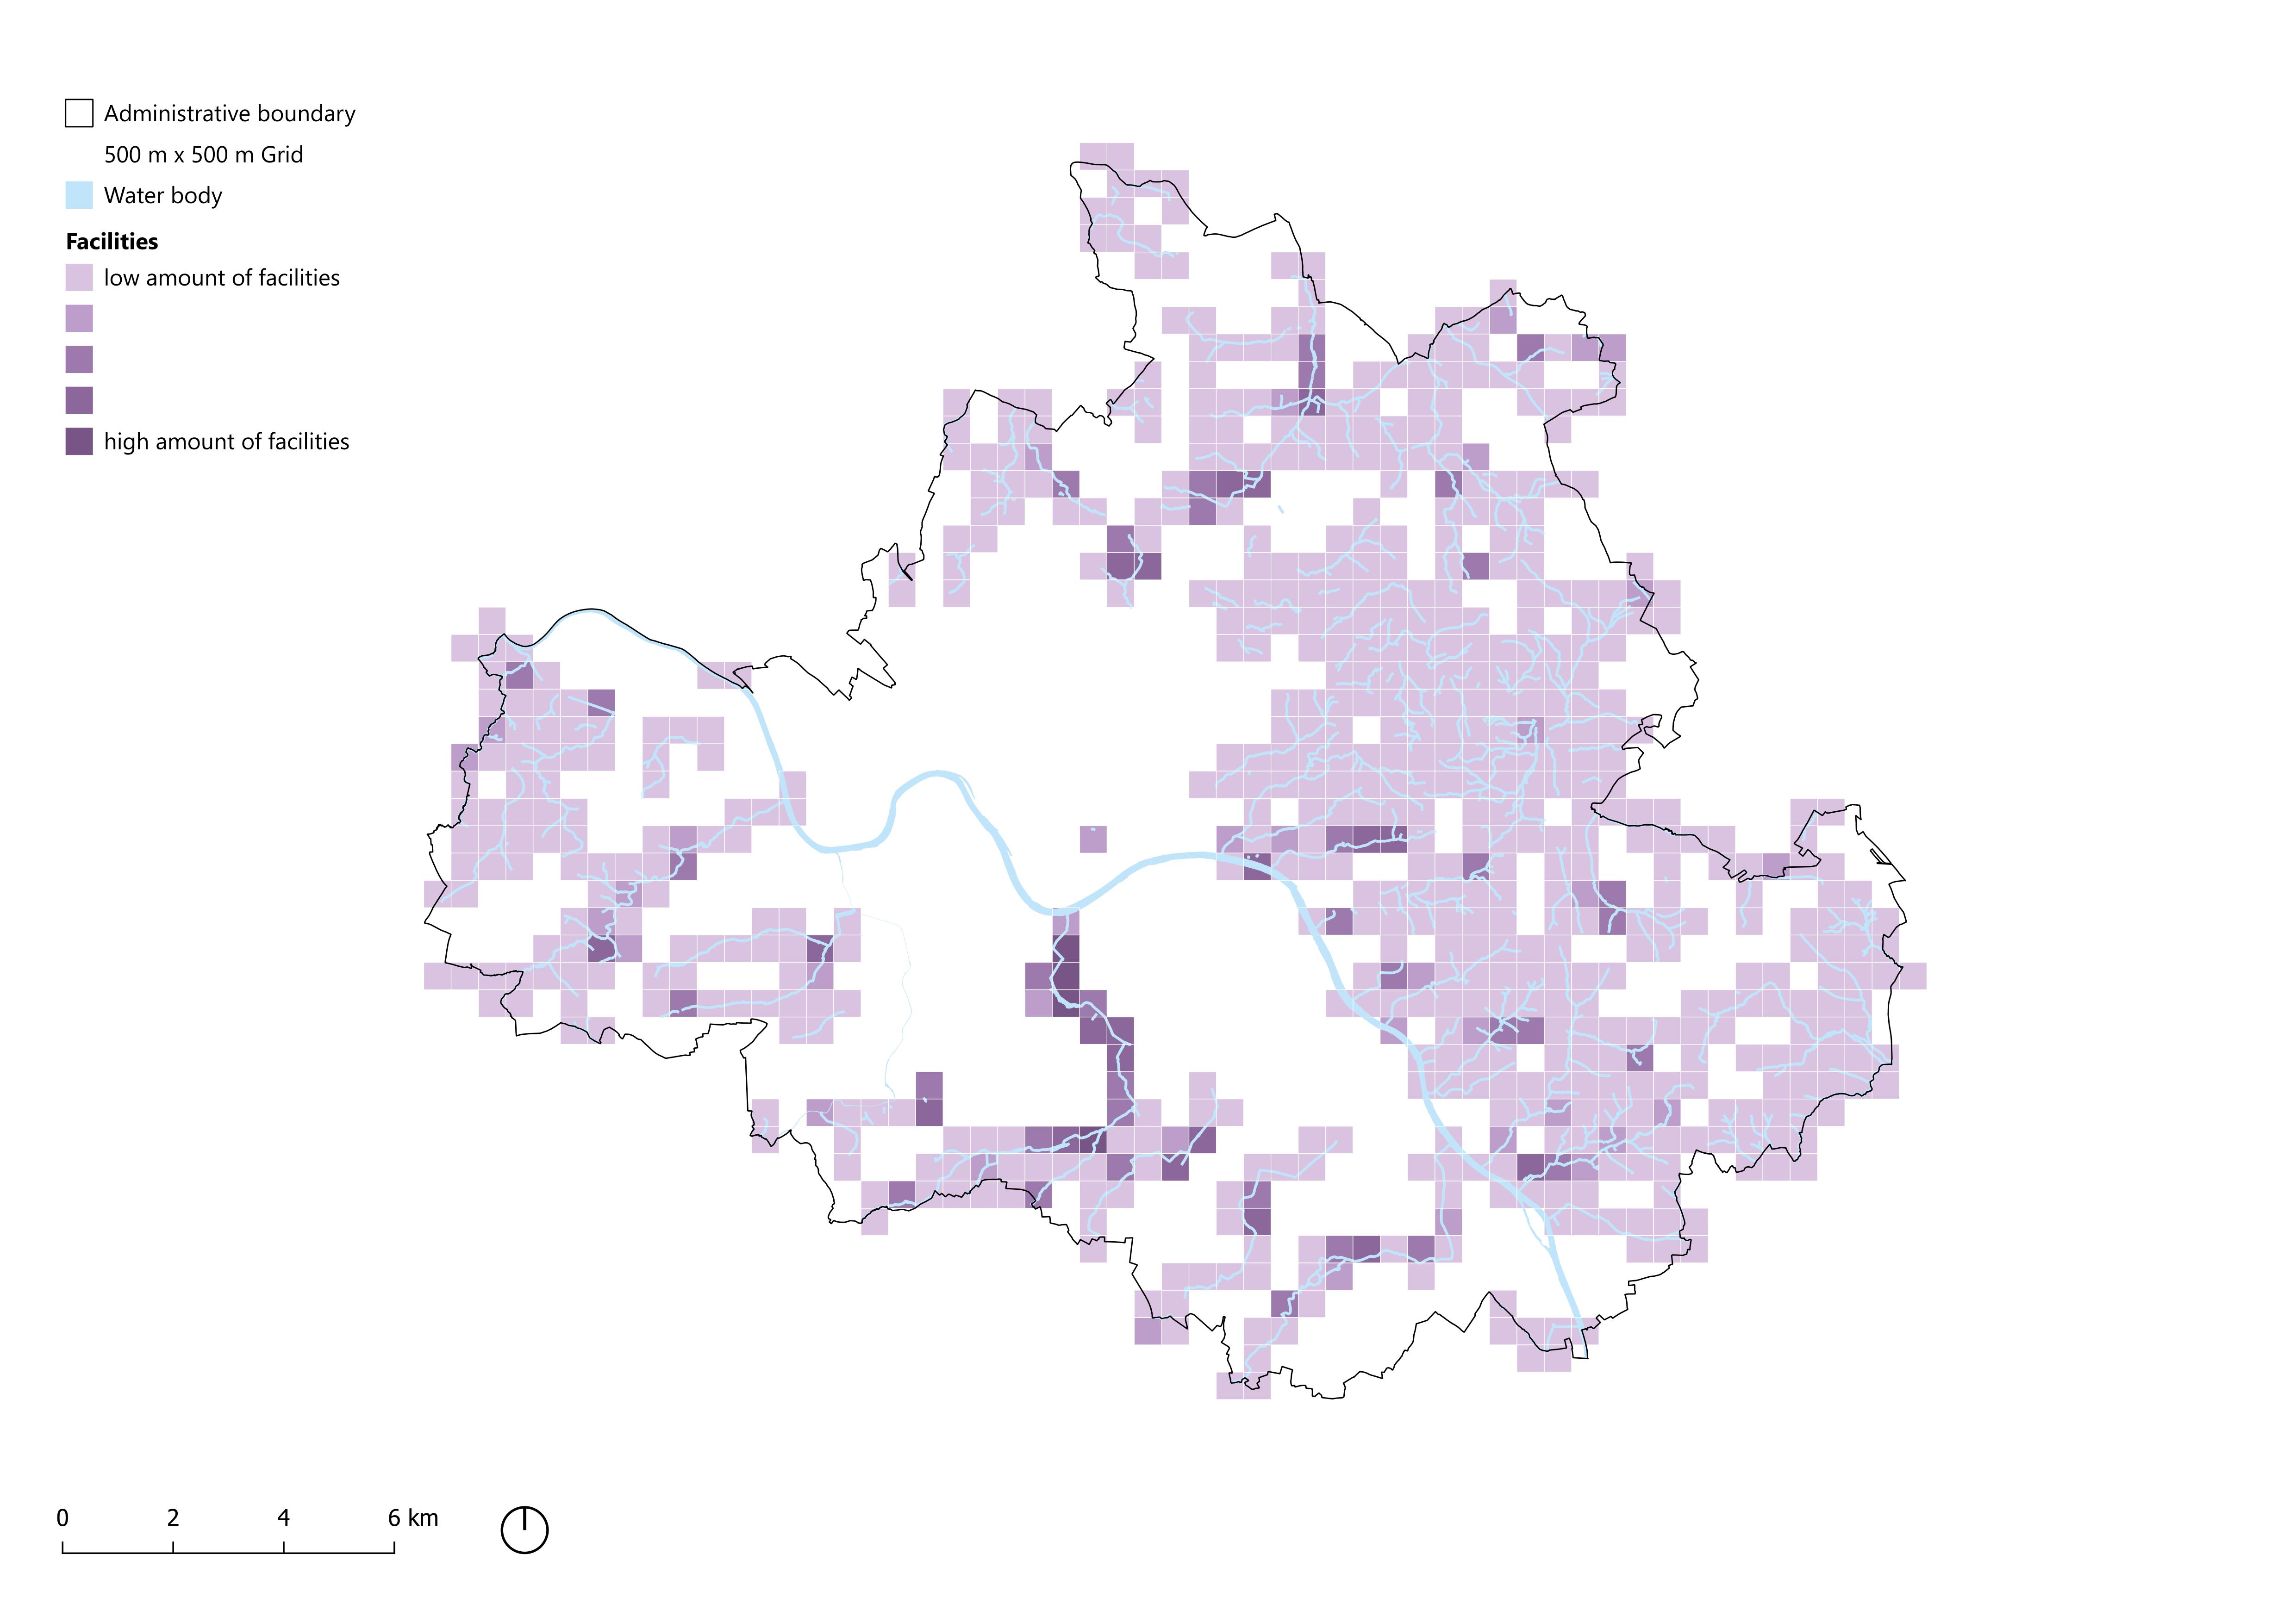
3.1.3 Facilities
The availability of different facilities is closely related to the use and attractiveness of public space (Roberts et al., 2019; Sugiyama et al., 2010). While the availability of seating arrangements does not directly correspond to an uptake in physical activity and thus an improvement in physical health (Giles-Corti et al., 2005), it does lead to an increase in the general use of public space and encourages more social interactions (Han et al., 2022). In this research, the focus on quality of life and the environmental impact on physical and mental health has primarily focused on the adult population. However, the impact of the younger generation should also be considered. A study conducted in the United States found that each additional play element attracts 50% more users and leads to 50% more physical activity in children (Cohen et al., 2019). Besides the positive impact on their physical health, playgrounds are also a catalyst for socialisation among children (Nordbø et al., 2019), and the availability of a playground can lower social anxiety in children (Bao et al., 2022).
In order to assess the current state of facilities around urban streams, a buffer of 50 metres was created. All seating arrangements and playgrounds, retrieved from OpenStreetMap and OpenDataPortal Dresden (2025B) within this buffer, were clipped and aggregated within the grid cells. The summed facilities were divided by the highest value, resulting in a scale from 0 to 1. Since the distribution of these values was skewed, with most values falling below 0.1, a logarithmic transformation was applied to achieve a more balanced distribution.
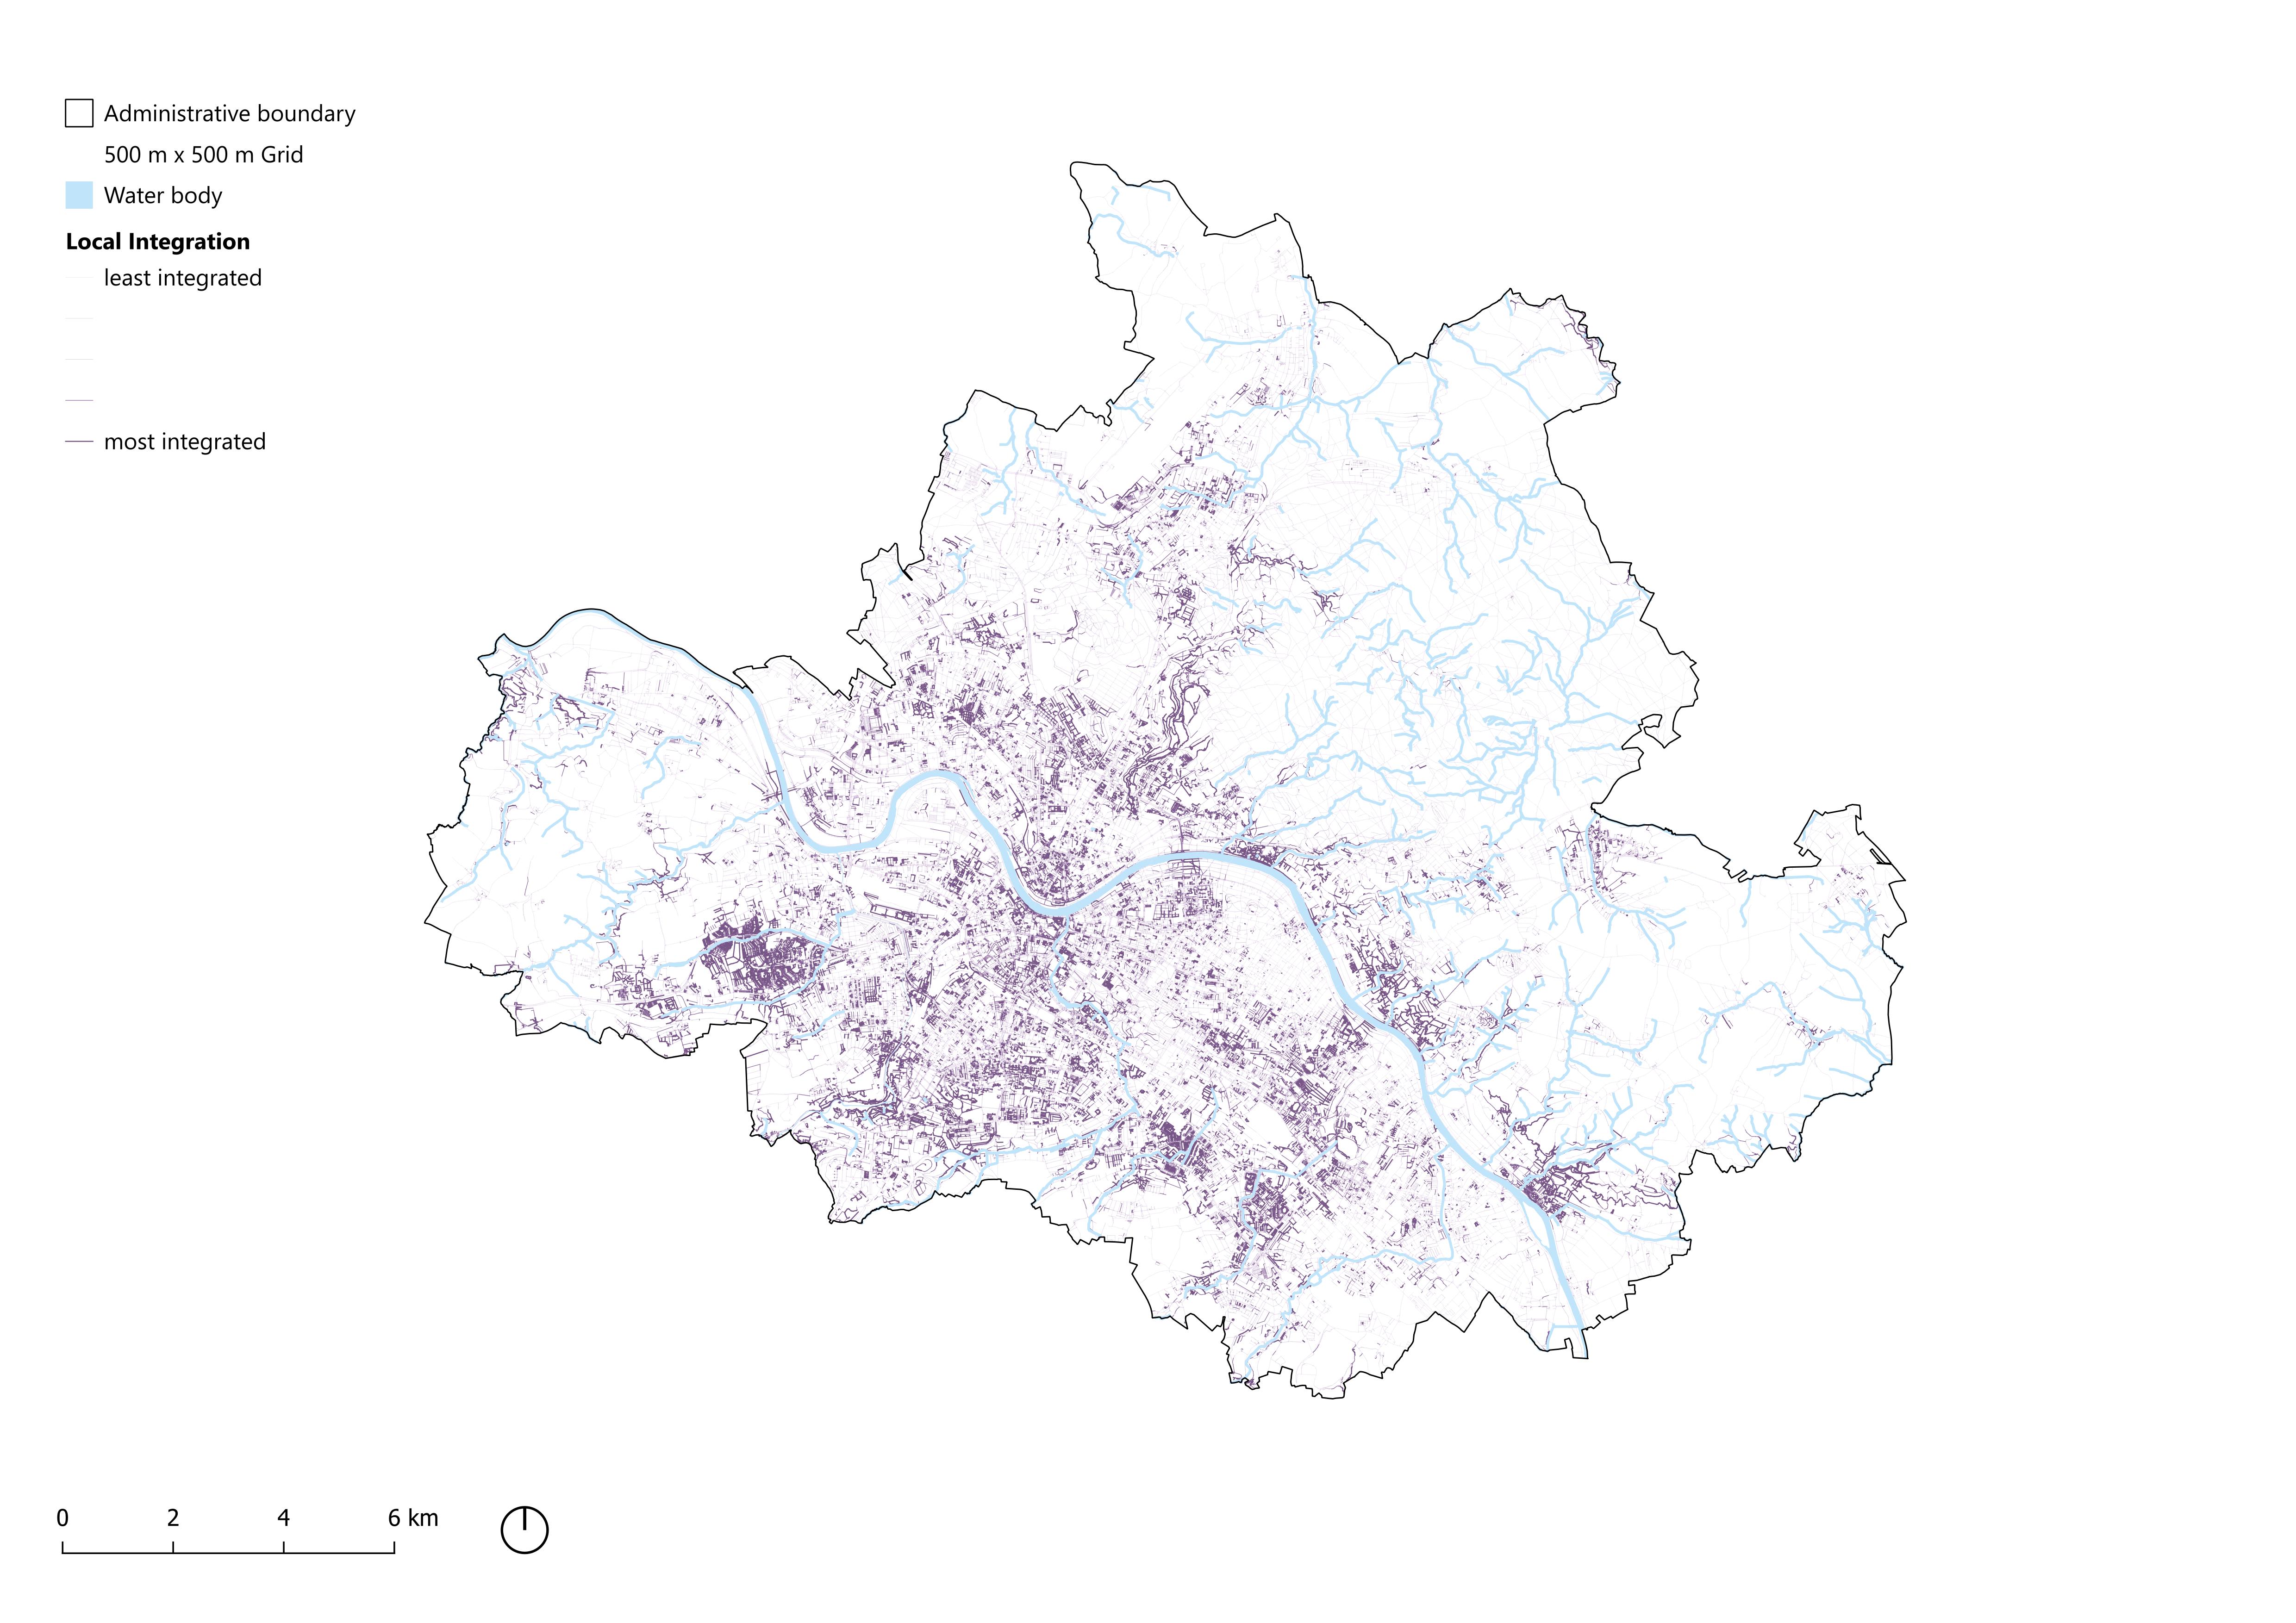
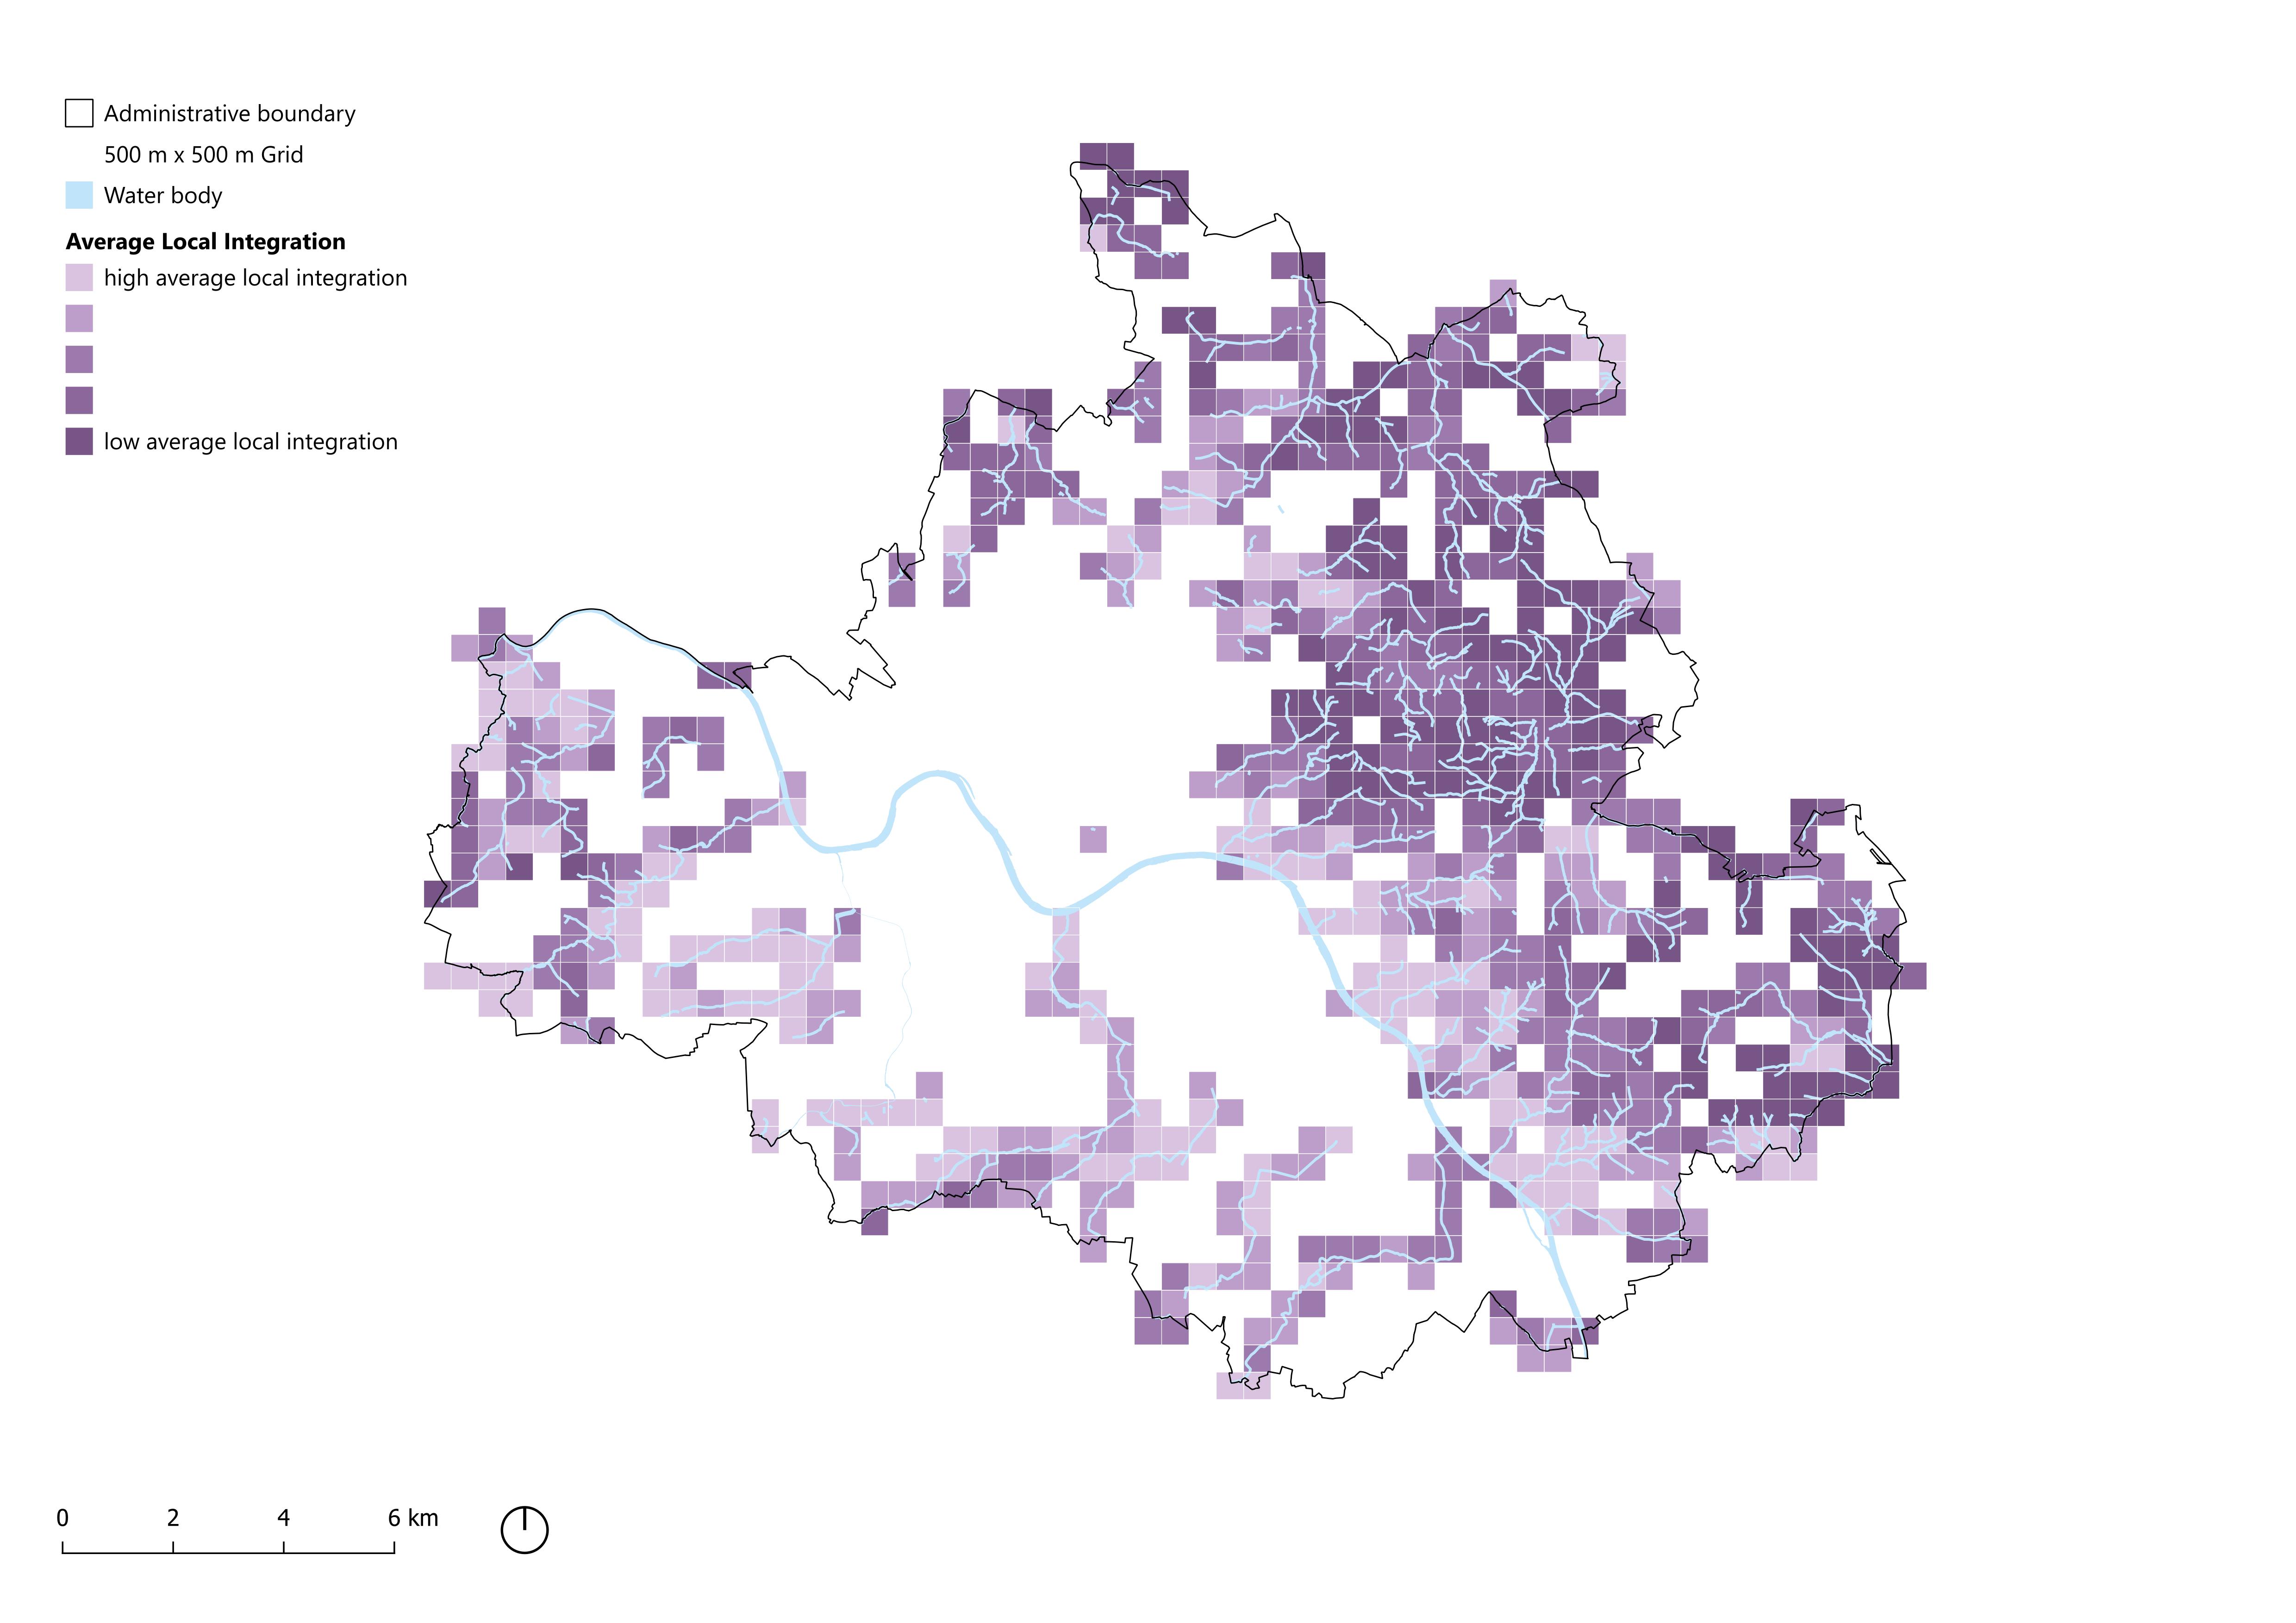
3.1.4 Local Integration
The local integration analysis can be used to define centres within a city based on the street pattern (Van Nes & Yamu, 2021). A radius of 500 meters is chosen to define the local centres. When locations with a high local integration intersect with urban green spaces, social interactions are more likely to happen (Sheng et al., 2021).
Besides the benefits of a higher local integration for the social quality of life, this variable can also be indicative of the number of people who will benefit from urban stream restoration in a given area. Local centres attract a high number of people; investments in these areas will thus positively impact a larger group than those with a lower local integration. This analysis was conducted using the Local Integration module of the Place Syntax Tool with a radius of 500 metres. Each segment receives an integration value by conducting this analysis. Through the aggregation of these values within the grid cells, followed by dividing by the number of line segments, it was possible to calculate the average value per segment within each cell. To normalise the grid values, the average local integration value per grid cell was divided by the highest value, resulting in a scale from 0 to 1.
3.1.5 Appearance
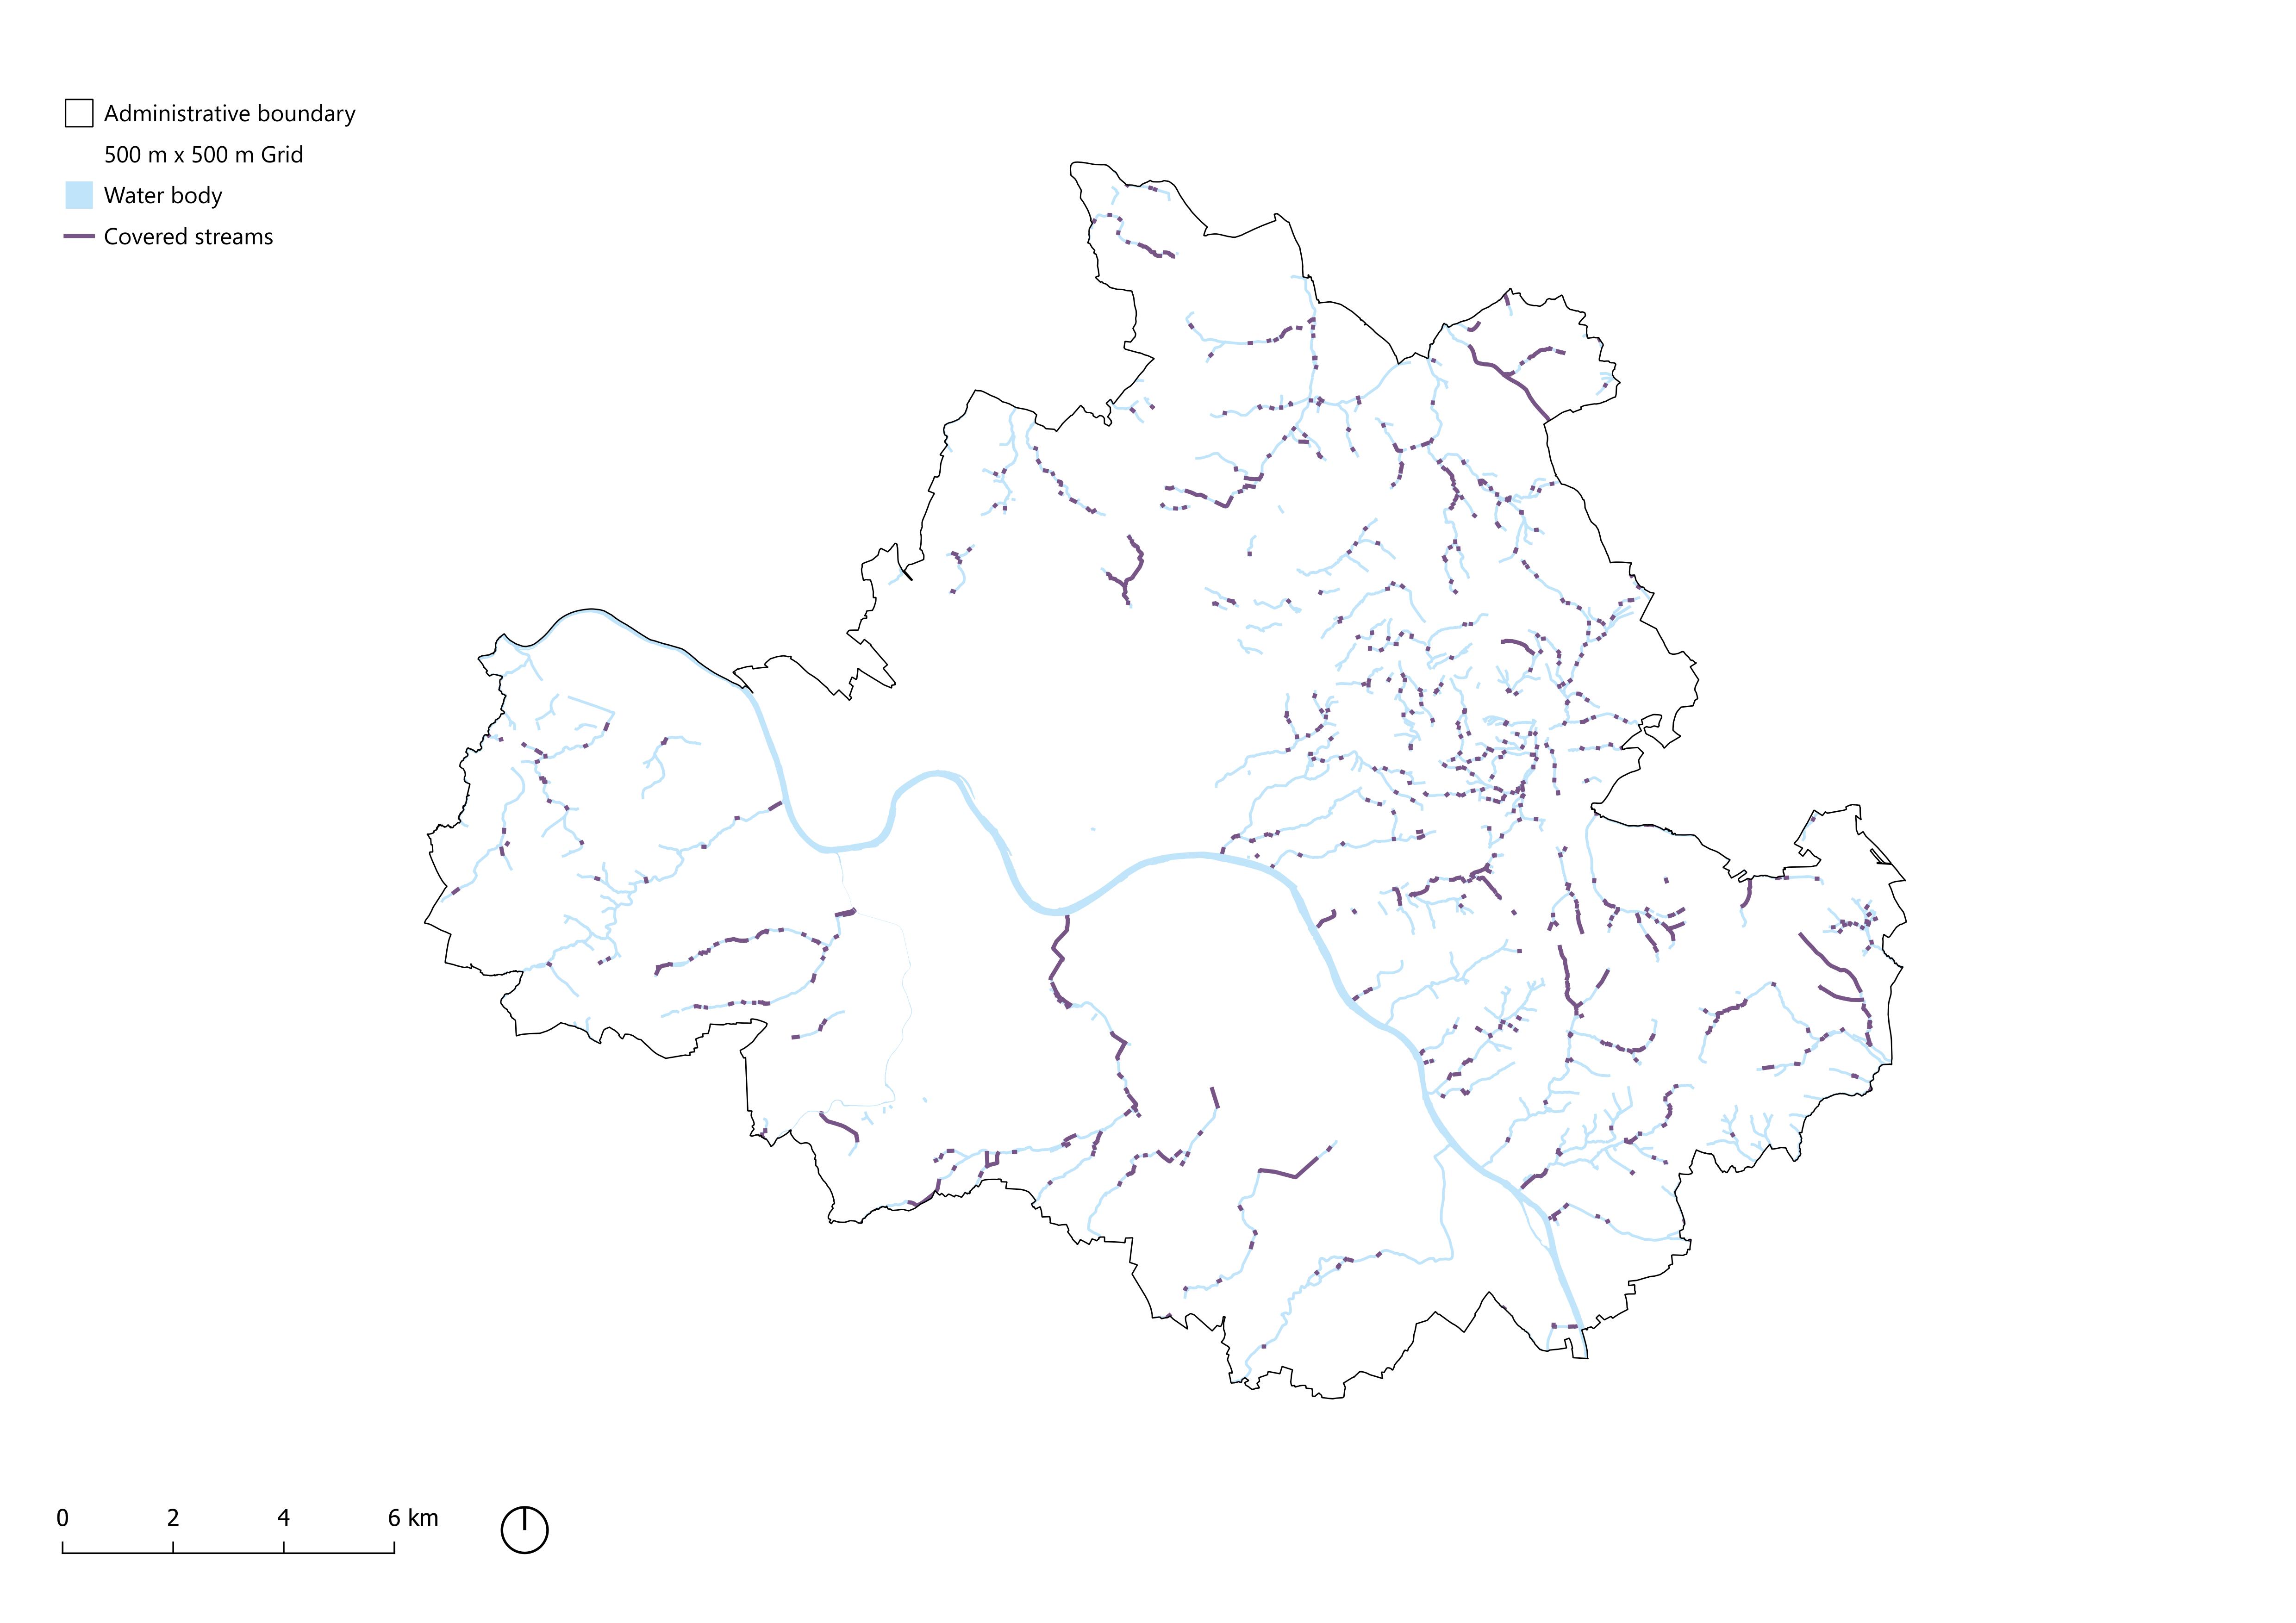
In recent decades, urban development in Dresden has resulted in many urban streams being covered, primarily to accommodate infrastructure and housing projects (Wantzen et al., 2022). However, as urban streams come with many benefits, which are summarized in this research, an effort can be made to reopen or daylight, the culverted streams.
The daylighting of urban streams would be part of a larger redevelopment project. As can be read in Wantzen et al. (2022, table 3), different project goals can be attained depending on the length of the stream being daylighted. Projects of up to 140 meters are typically aimed at improving recreational value, and thus quality of life, while projects exceeding 140 metres primarily focus on enhancing biodiversity. To reflect this distinction, stream lengths were normalised using a calculation that assigns a value of 0 to any length between 0 and 140 metres. After 140 meters, the value slowly increases to 1. While daylighting would also benefit larger portions of culverted urban streams, these were given a lower value, as it is less feasible to implement such large projects.
Click to show/hide the SQL code for the normalisation calculation
round(
  CASE
    WHEN "length" <= 140 THEN 0
    WHEN "length" > 140 AND "length" <= 2500 THEN ( "length" - 140 ) / (2500 - 140)
    ELSE 1
  END,
  3
)
3.1.6 Saaty Matrix
In order to compile the five different layers into a single map representing the quality of life in the city of Dresden, weights must be assigned to each individual layer. The variables impacting physical and mental health, the vicinity to urban green and blue spaces, have been given the highest priority. Following health, social interaction is also seen as an important component within quality of life, which is why the variables concerning facilities and local integration have been assigned a similar weight. The daylighting of covered streams, while important, has been given a very minimal weight in the analysis, as daylighting might not always be feasible.
3.1.7 Recreational Suitability
The municipality of Dresden has assessed the recreational suitability across the entire city. Although this data was collected, it was ultimately not included in the weighted map. Had it been used, the locations which could have used the most improvement, areas scoring low on the recreational suitability index, would have been seen as most suitable for the urban stream restoration project, as there would be much to gain from improving these locations. However, this data identifies the critical infrastructure as the least suitable location for recreation. This assessment would therefore suggest that such infrastructure is ideal for stream restoration, which is not feasible. Therefore, this data was not considered in the weighted map.
Click to show/hide the SQL code for the normalisation calculation
CASE
  WHEN "bewertung" = 'Eignung für die örtliche und stadtweite Naherholung' THEN 1.0
  WHEN "bewertung" = 'Eignung für die regional bedeutsame Naherholung mit touristischem Potential' THEN 0.75
  WHEN "bewertung" = 'Eignung für Tourismus' THEN 0.75
  WHEN "bewertung" = 'Eingeschränkte Eignung für die lokale Naherholung' THEN 0.5
  WHEN "bewertung" = 'Geringe Wertigkeit für die freiraumbezogene Erholung' THEN 0.25
  WHEN "bewertung" = 'Keine Eignung für die freiraumbezogene Erholung' THEN 0.0
  ELSE NULL
END
3.2 Climate Adaptation
According to Ranta et al. (2021), if urban streams are reverted (almost) to their original state, they can serve as a nature-based solution by providing various services such as better aesthetics, air quality, leisure areas, and mitigation of climatic changes- this integration of blue-green spaces within cities. To achieve this, this project analyses the various ecological aspects and ecosystem services that need to be addressed.
3.2.1 Flood Risk
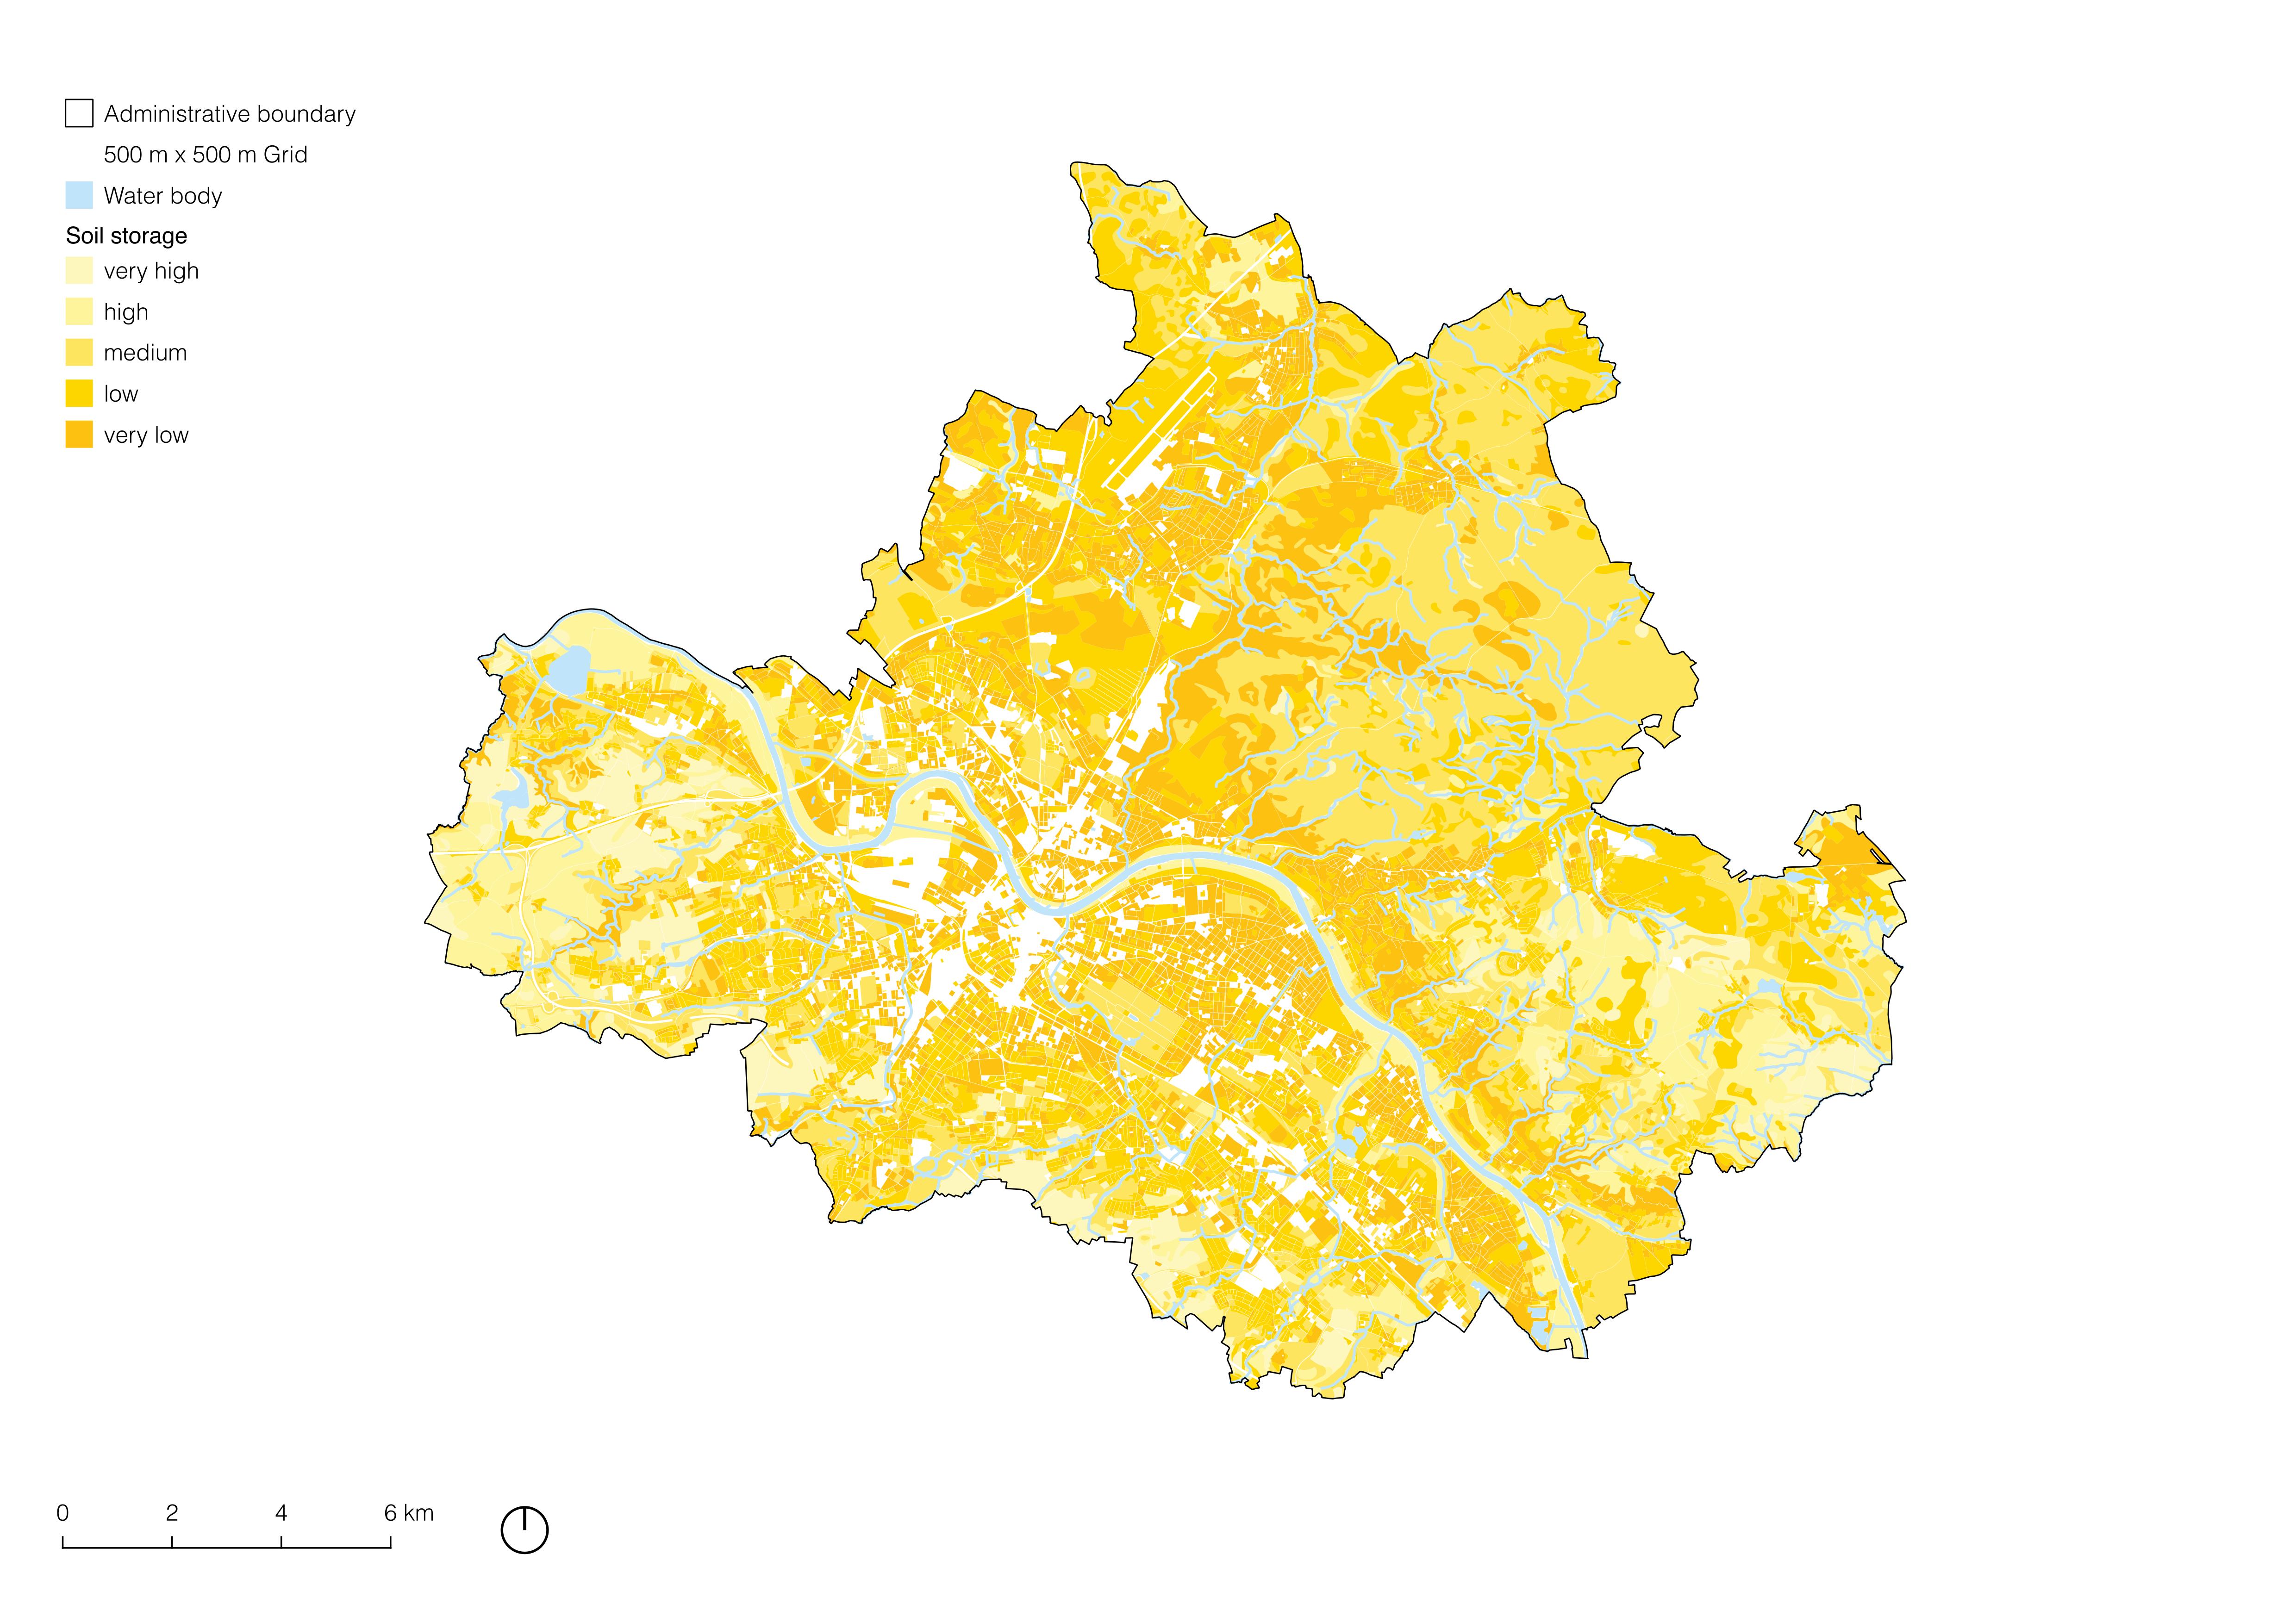
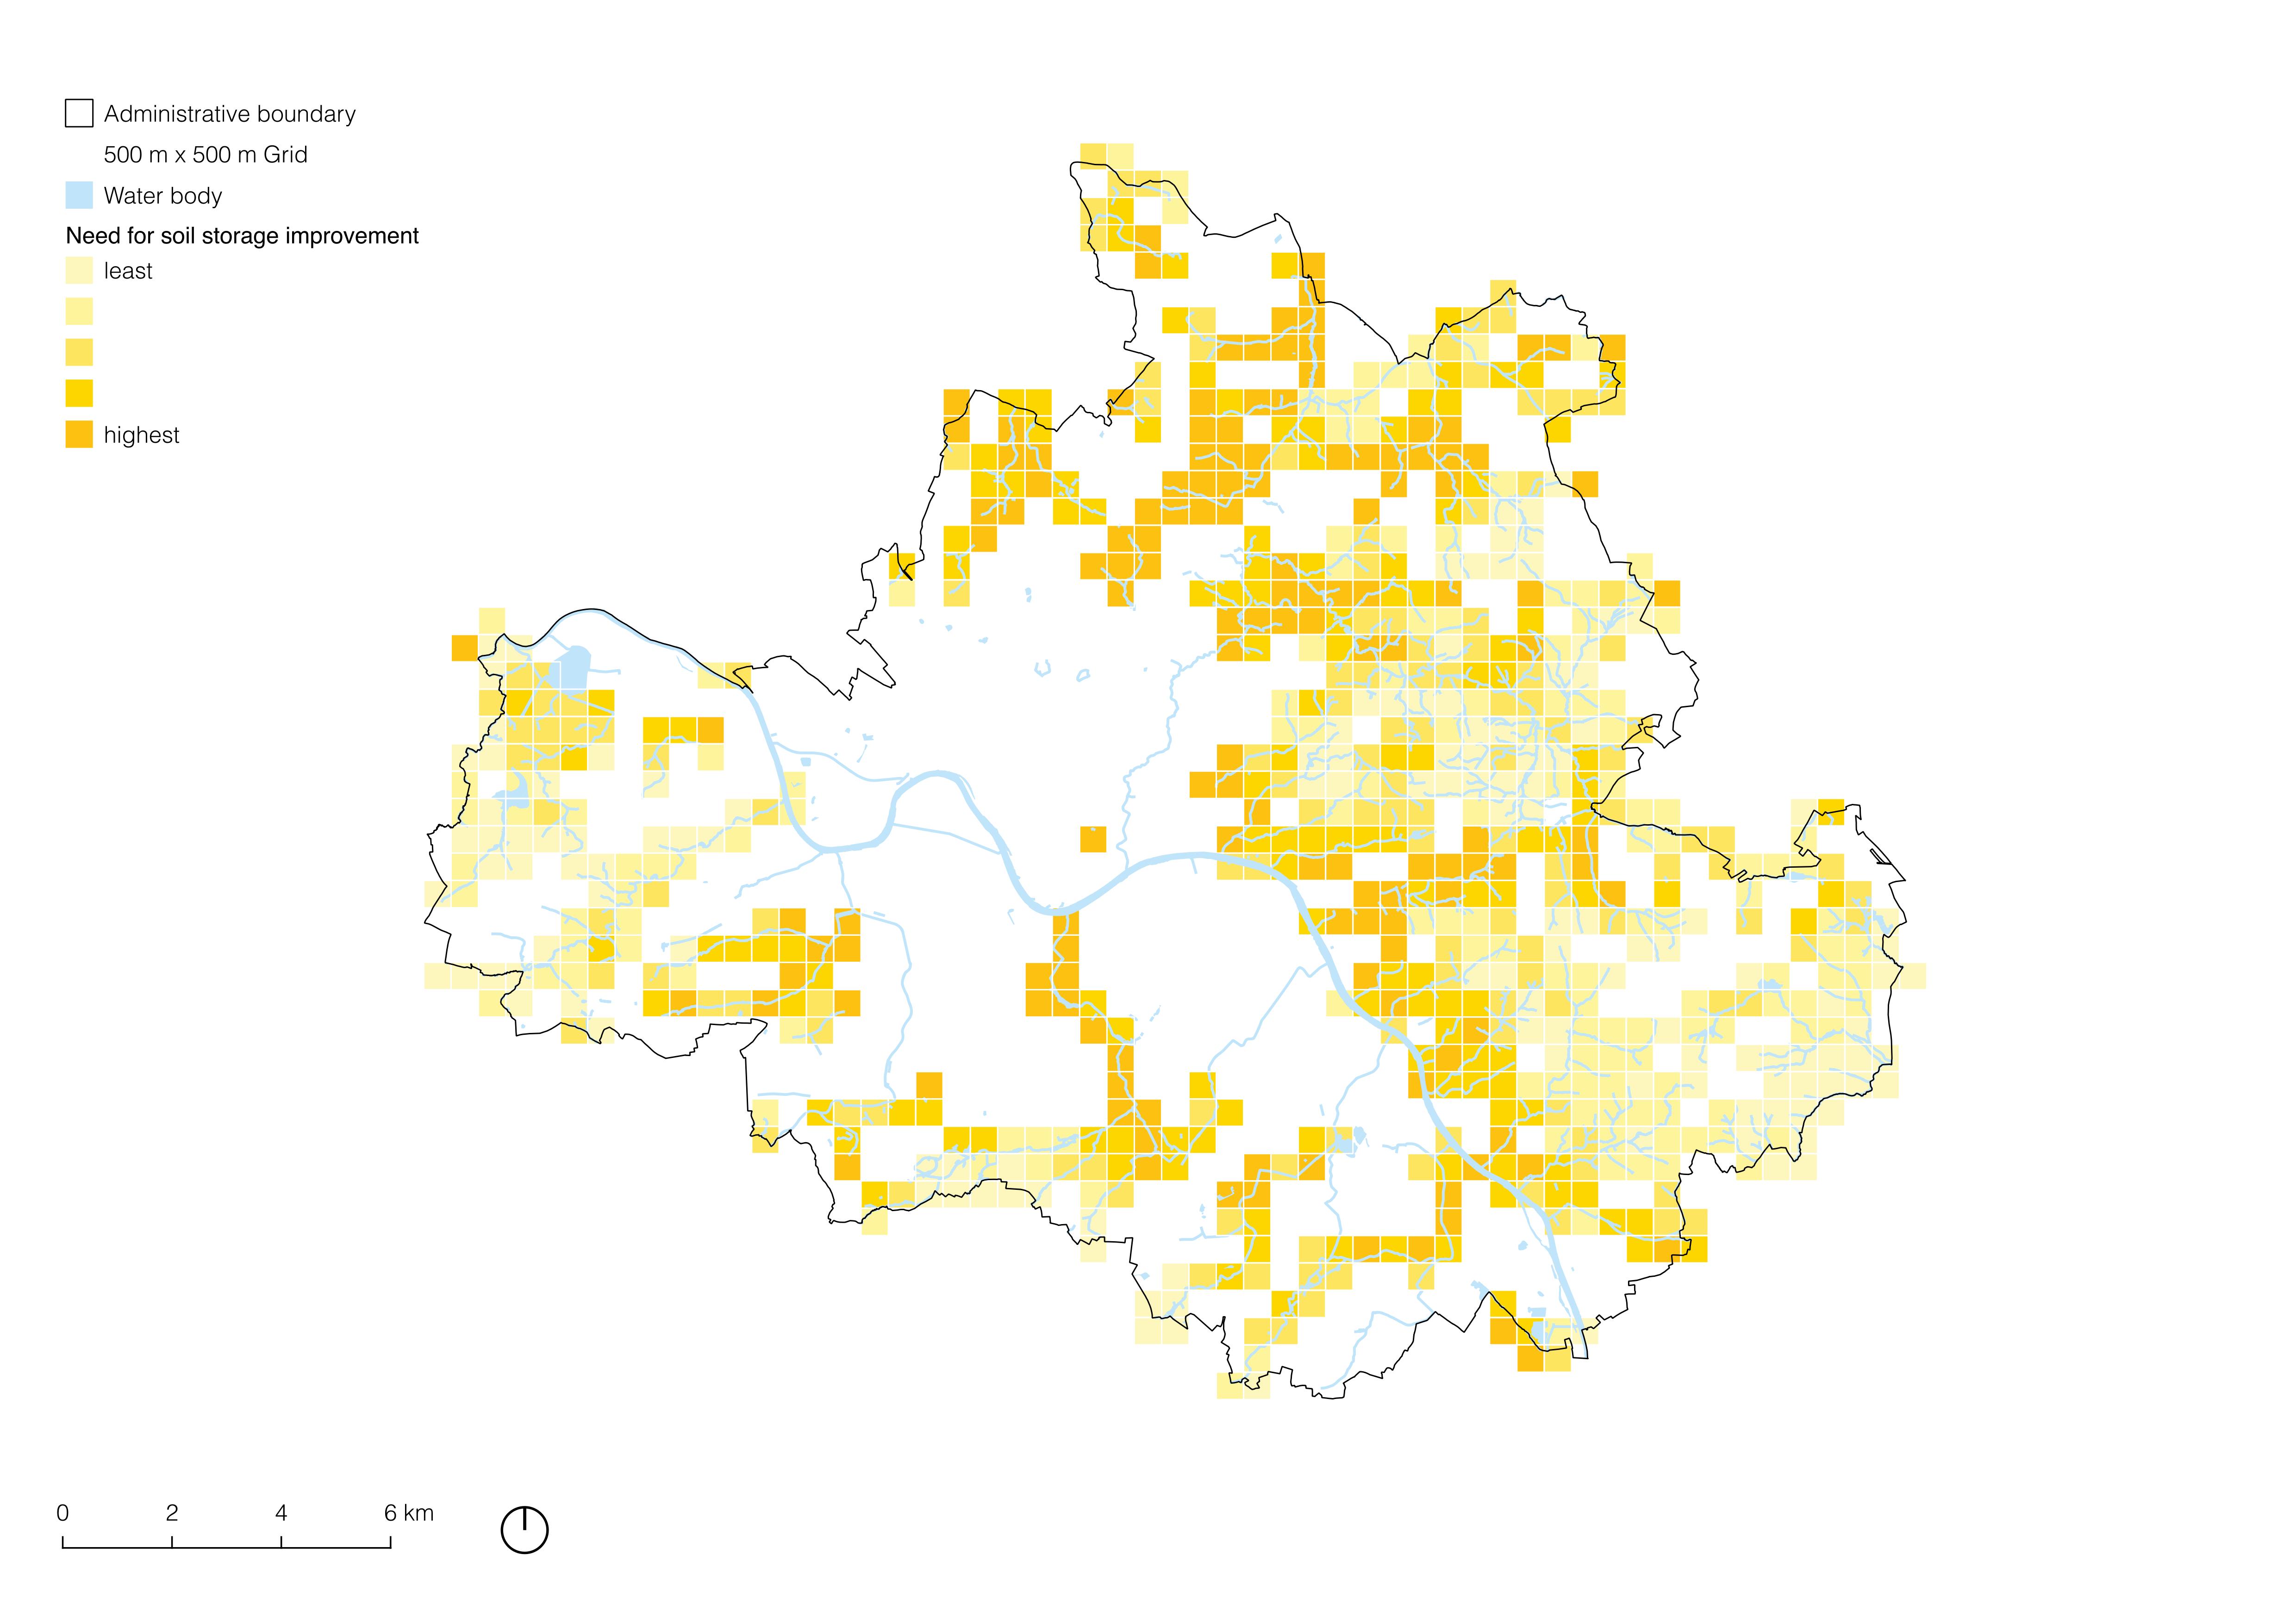
Soil storage capacity plays a crucial role in reducing flood risk and supporting urban stream restoration. Soils with high storage capacity absorb and hold rainfall, reducing surface run-off and peak flood flows (Dietz, 2007). This buffering effect decreases the likelihood of flash flooding in urban areas where impervious surfaces dominate. Moreover, enhanced soil storage promotes groundwater recharge, sustaining stream baseflows during dry periods and improving aquatic habitat stability (Booth et al., 2002). In urban stream restoration, improving soil structure and organic content increases storage capacity, helping to restore natural hydrologic functions and resilience against climate extremes (Palmer et al., 2014).
3.2.2 Urban Heat Island Effect
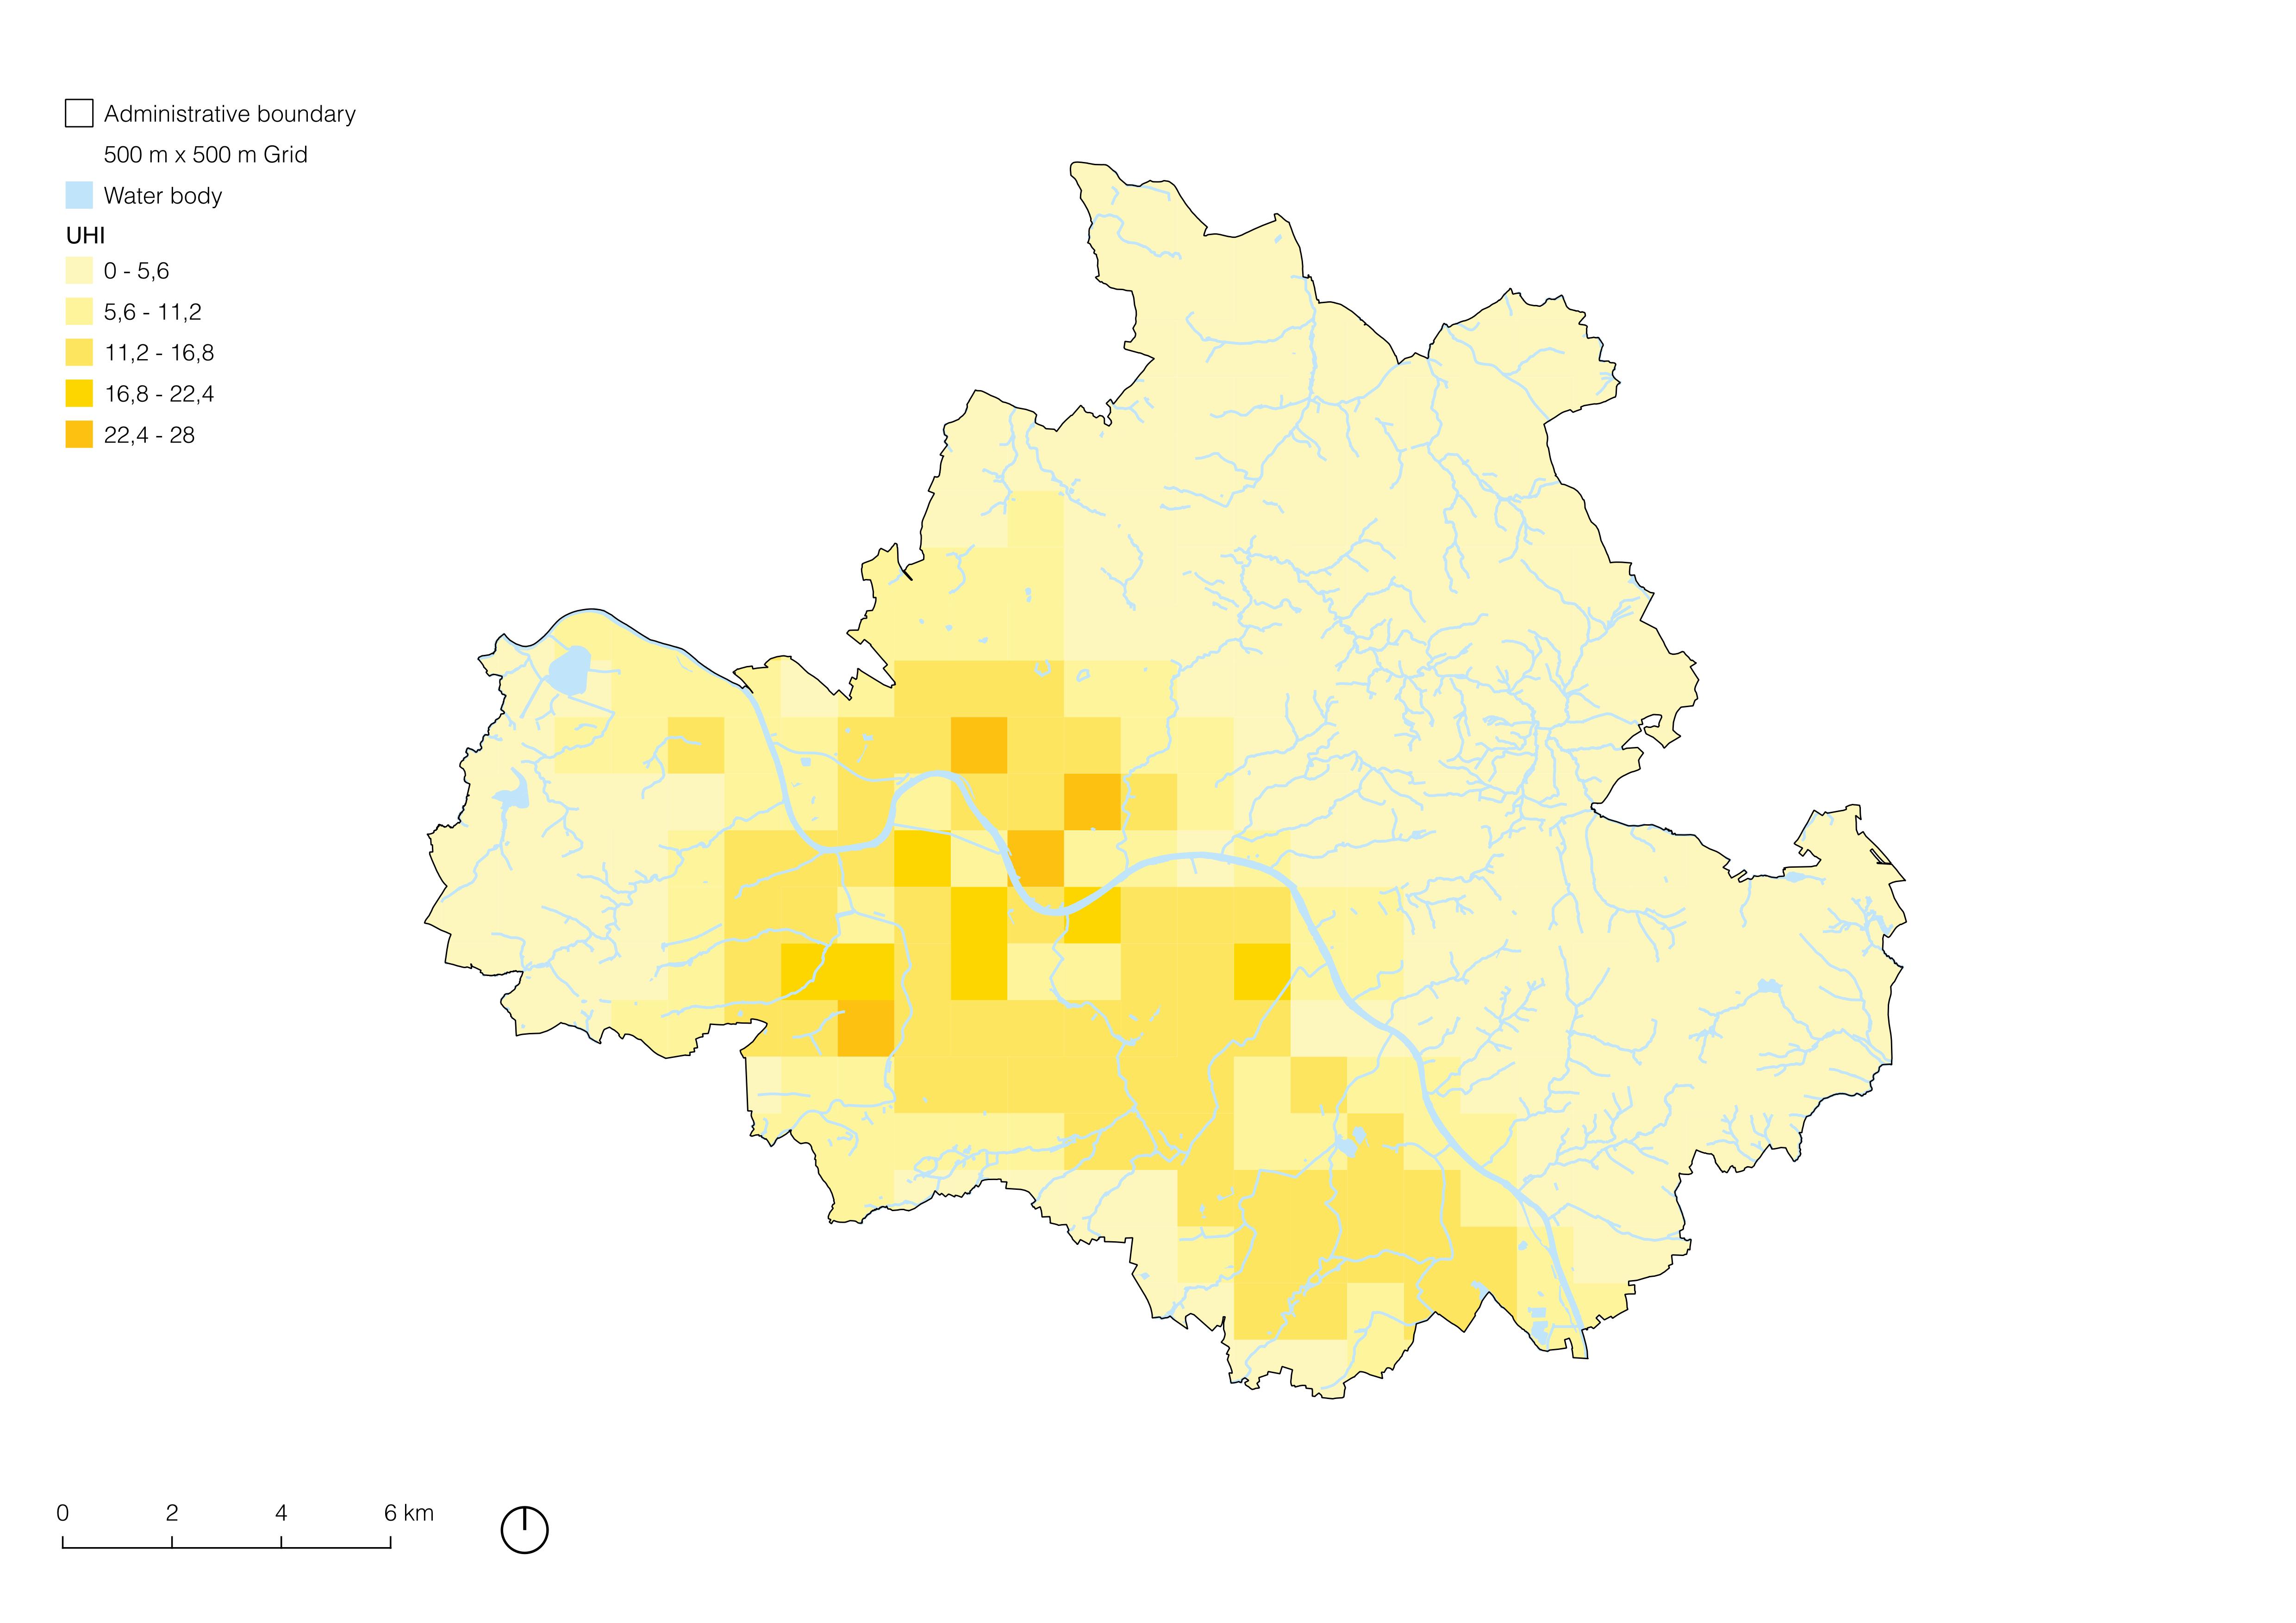
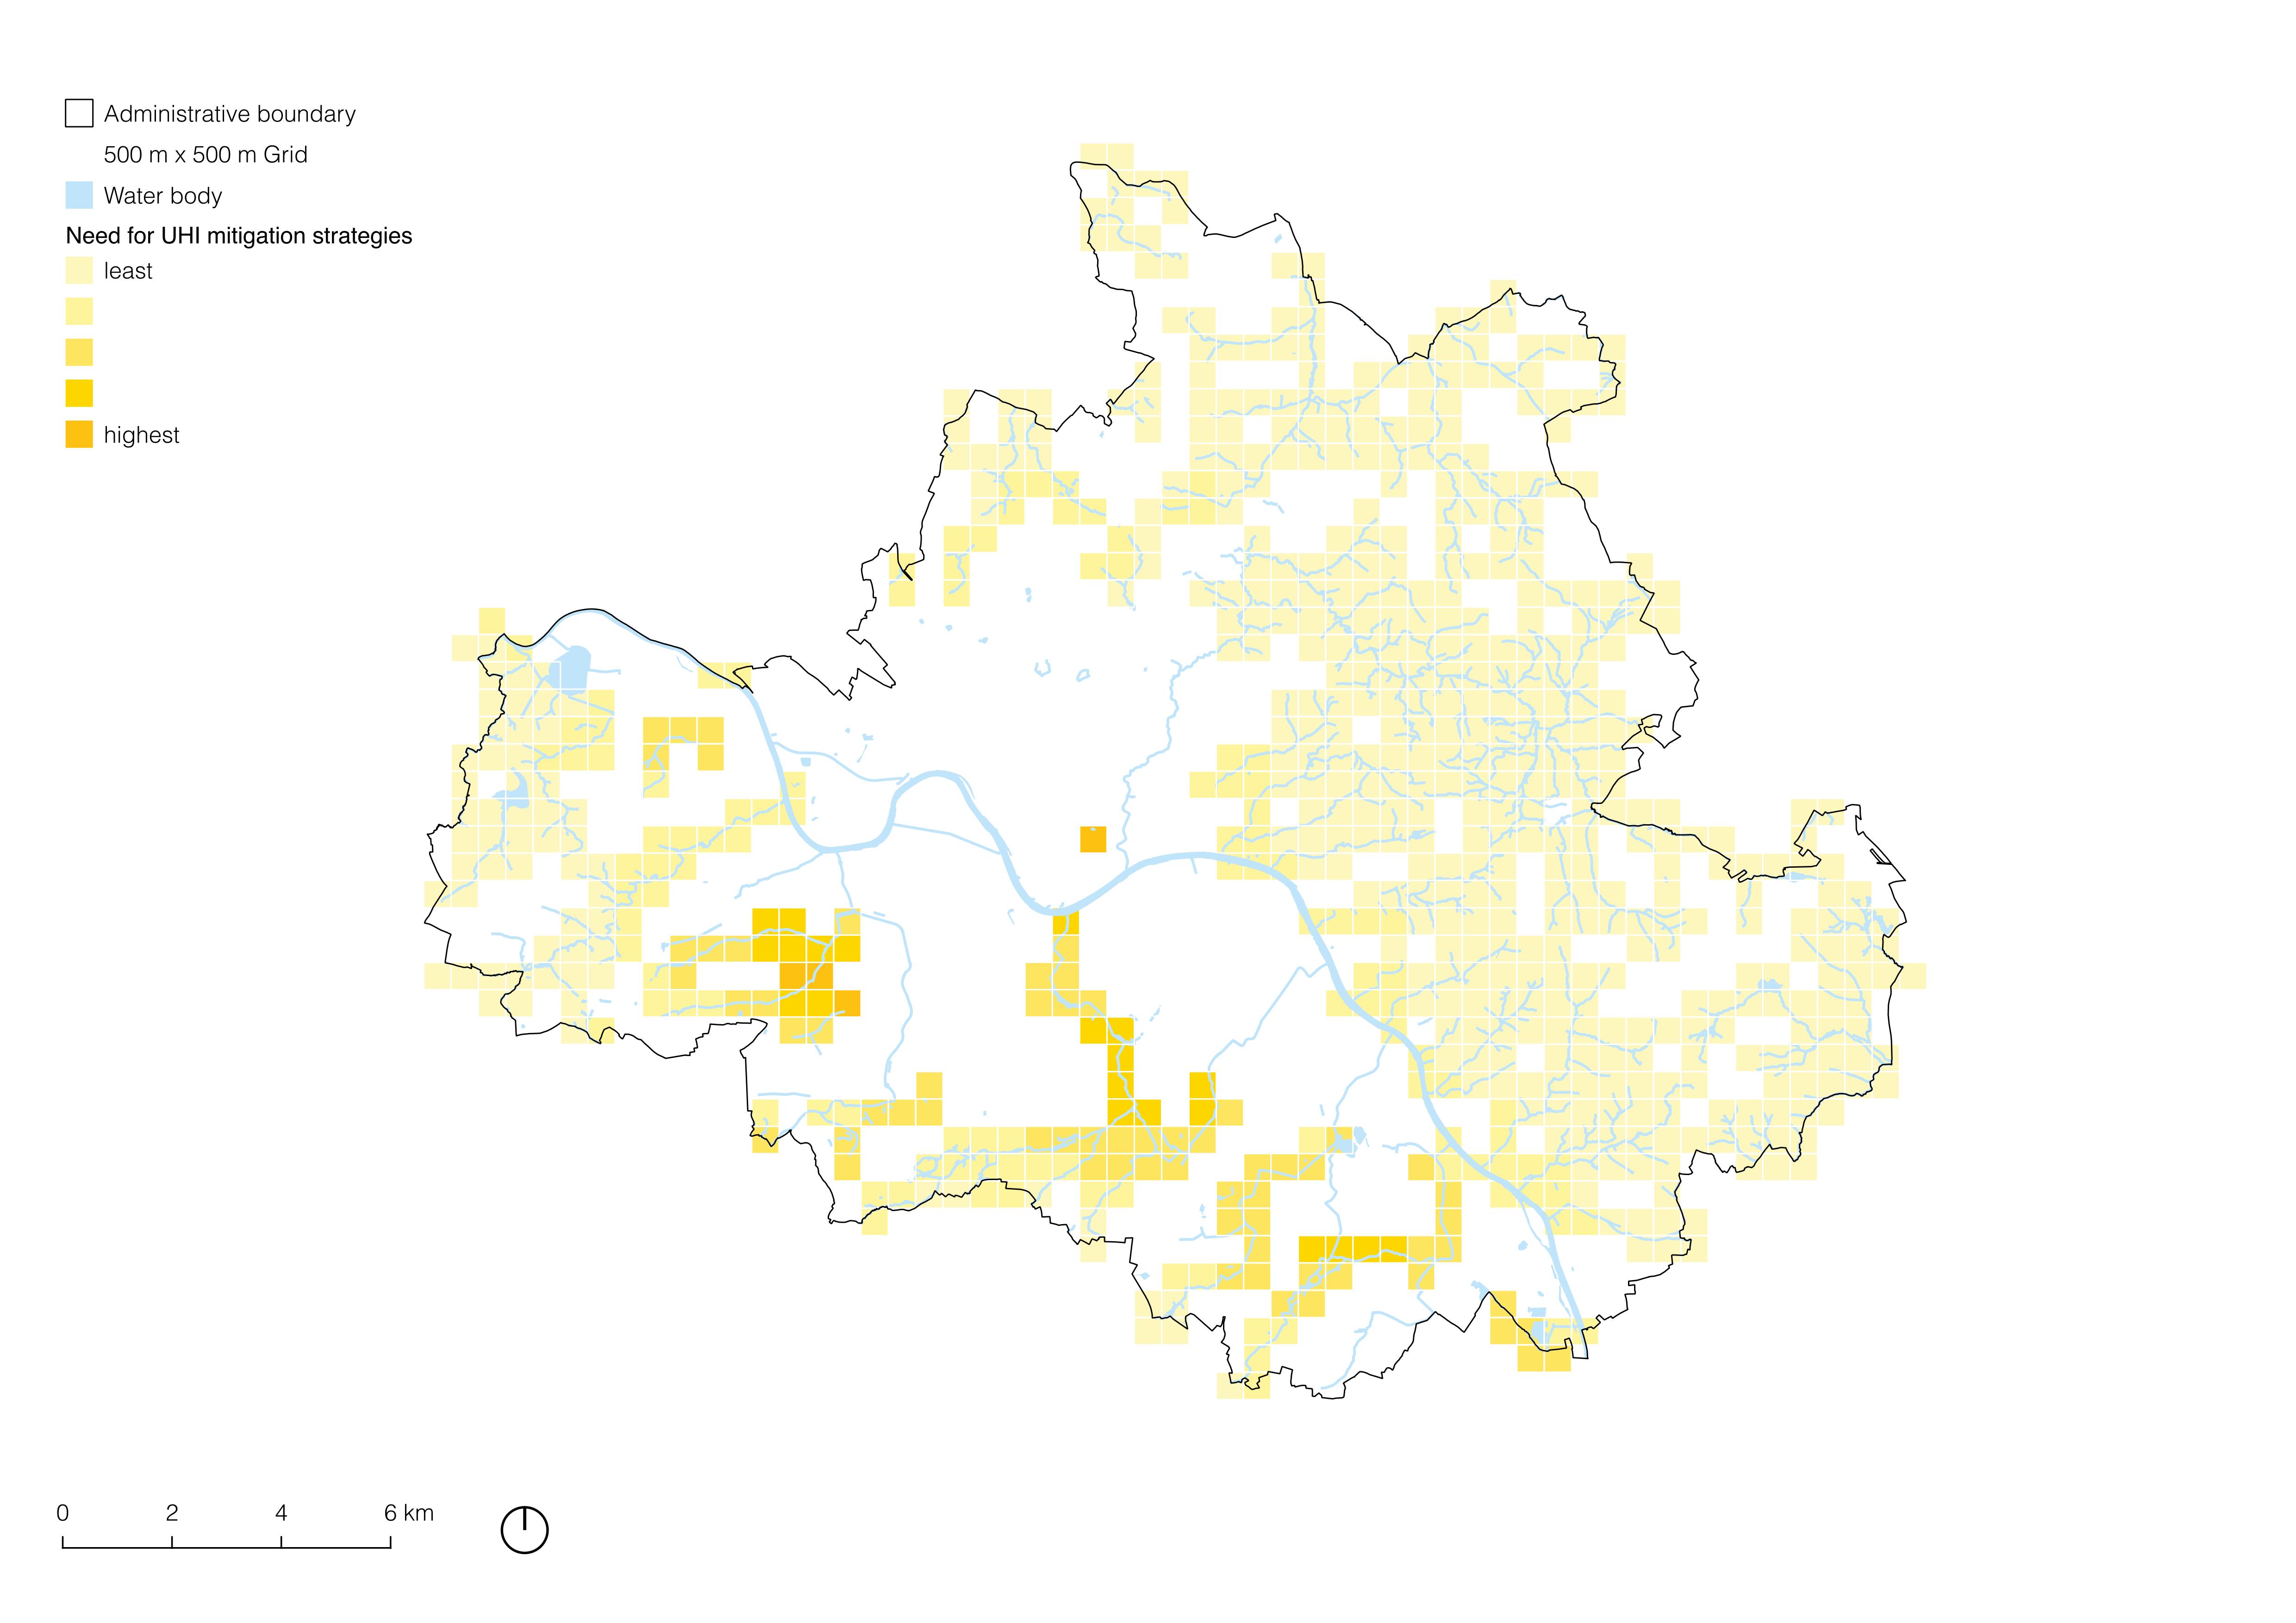
Higher Urban Heat Island (UHI) effects in Dresden elevate stream temperatures, reduce dissolved oxygen, and stress aquatic ecosystems. Impervious surfaces exacerbate run-off and thermal pollution, degrading urban water quality and biodiversity. Mitigating UHI is essential for urban stream resilience and climate adaptation.
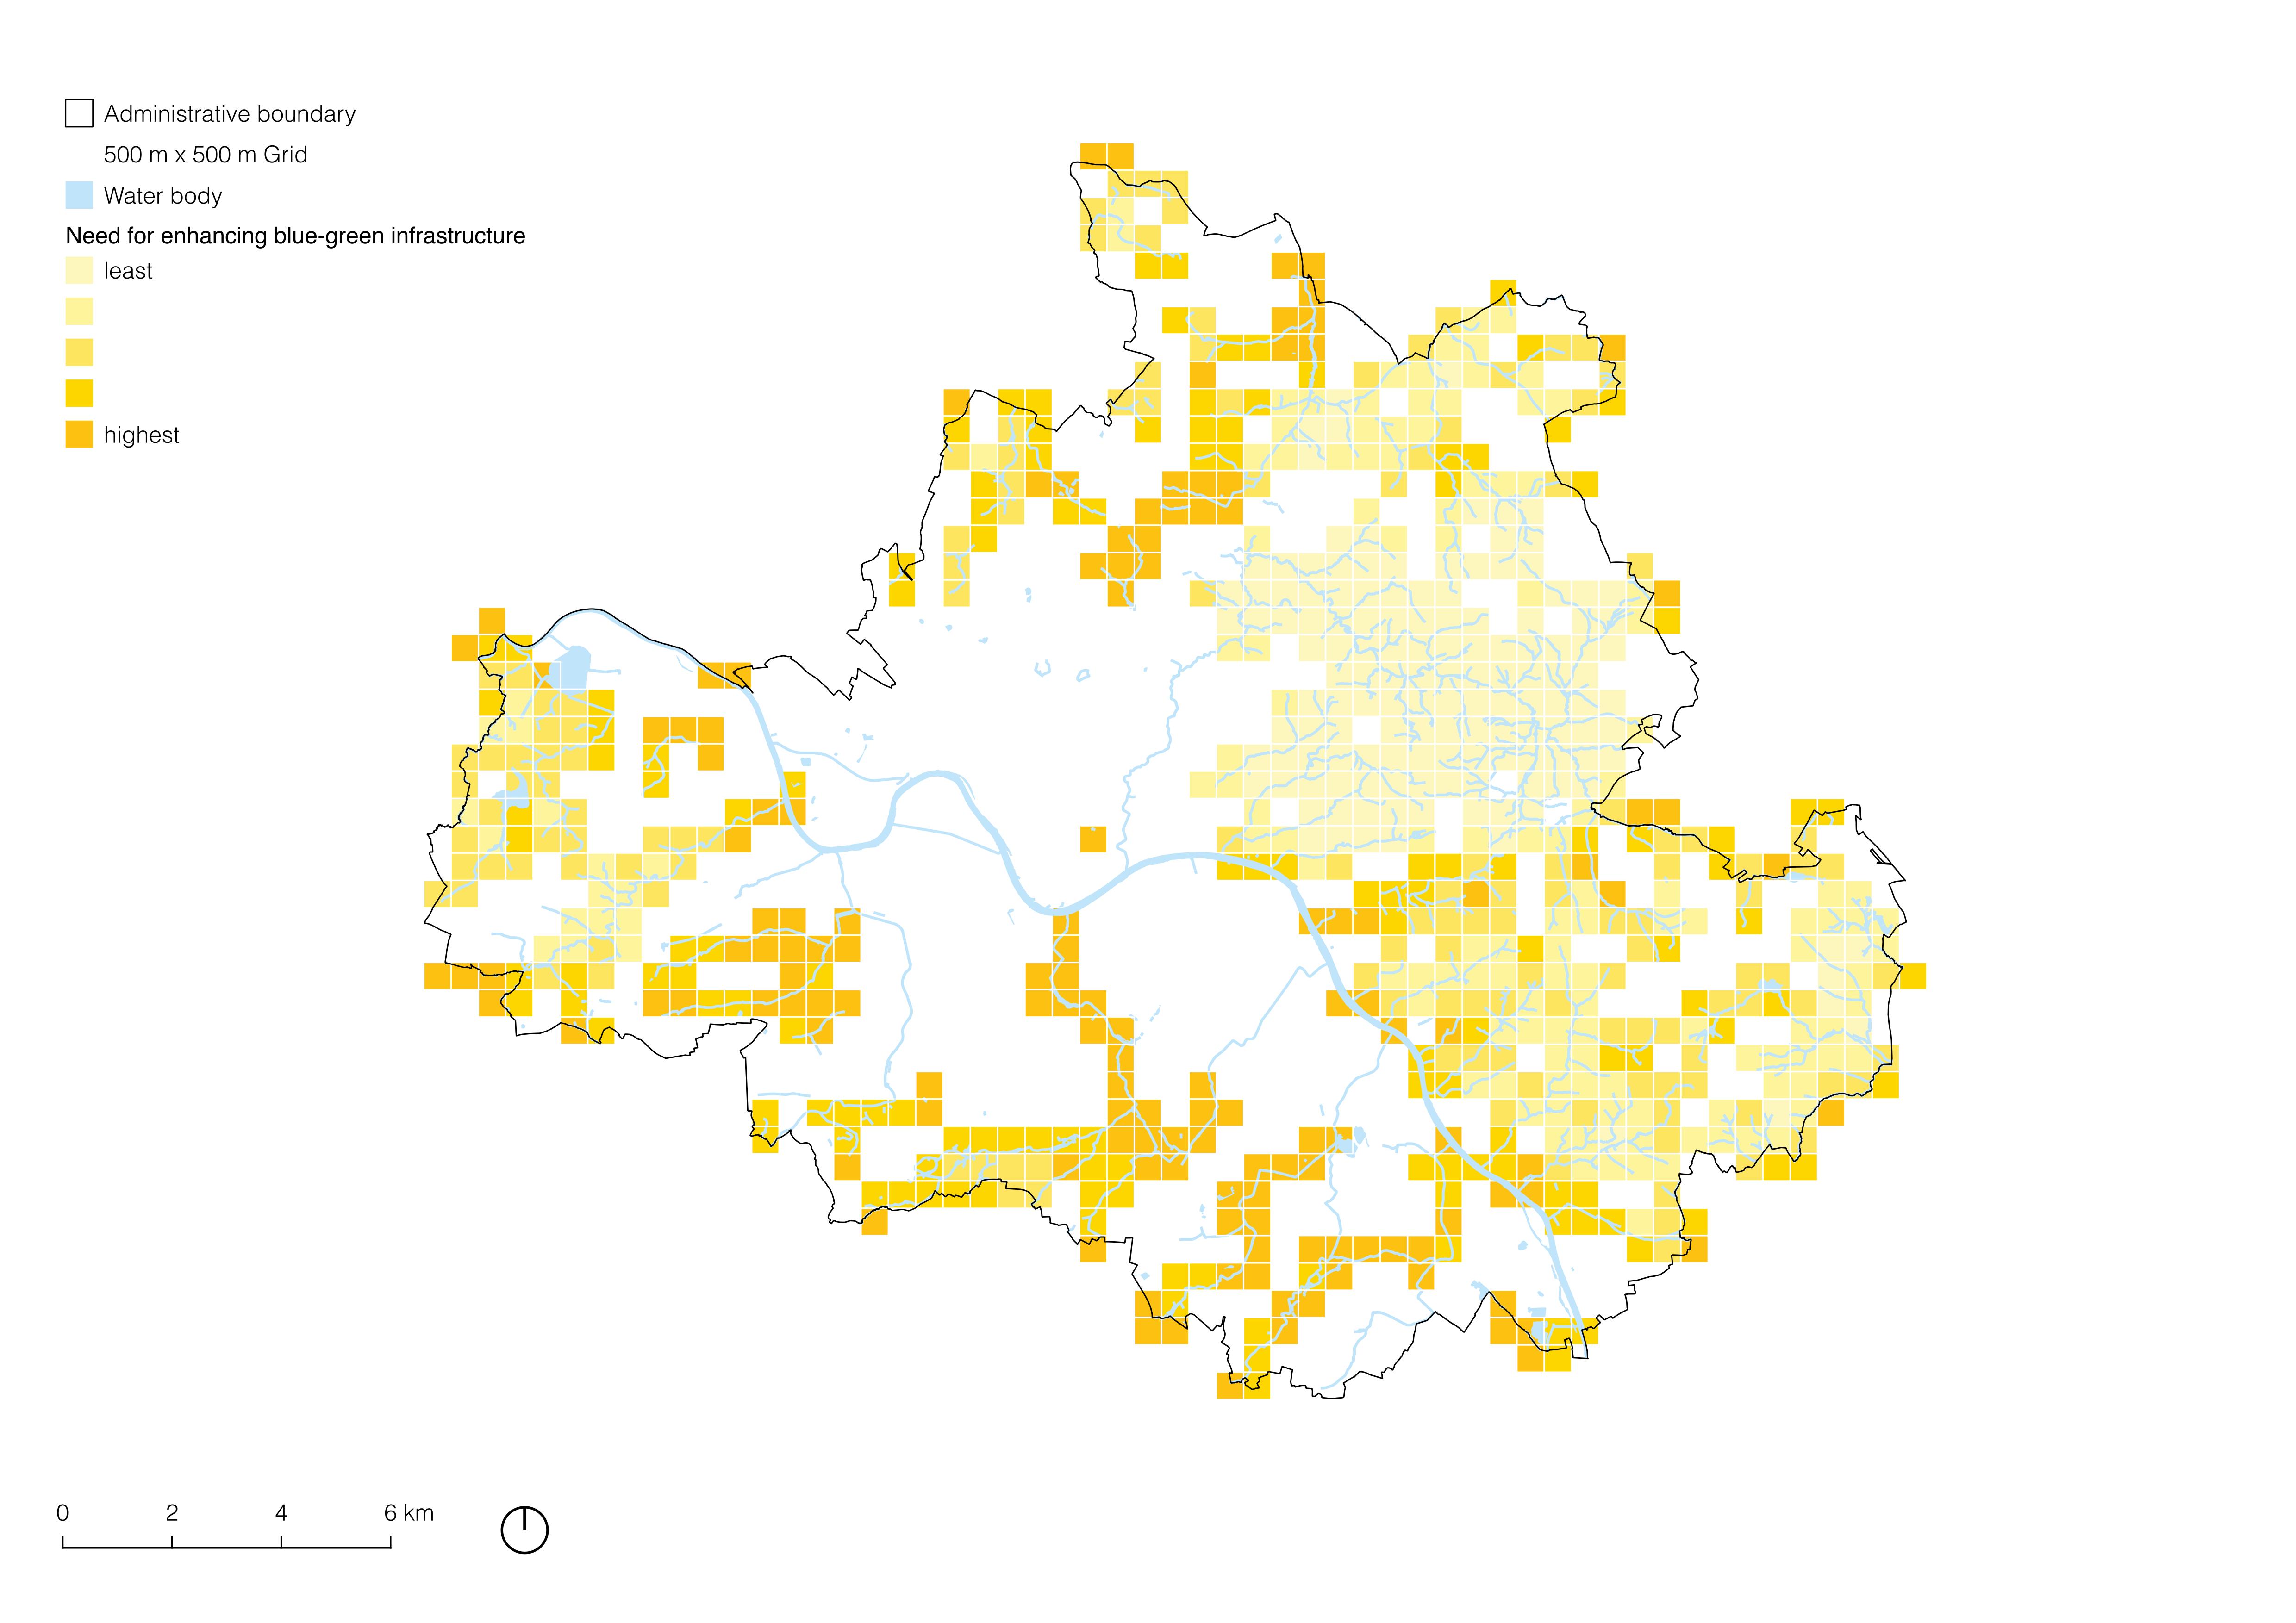
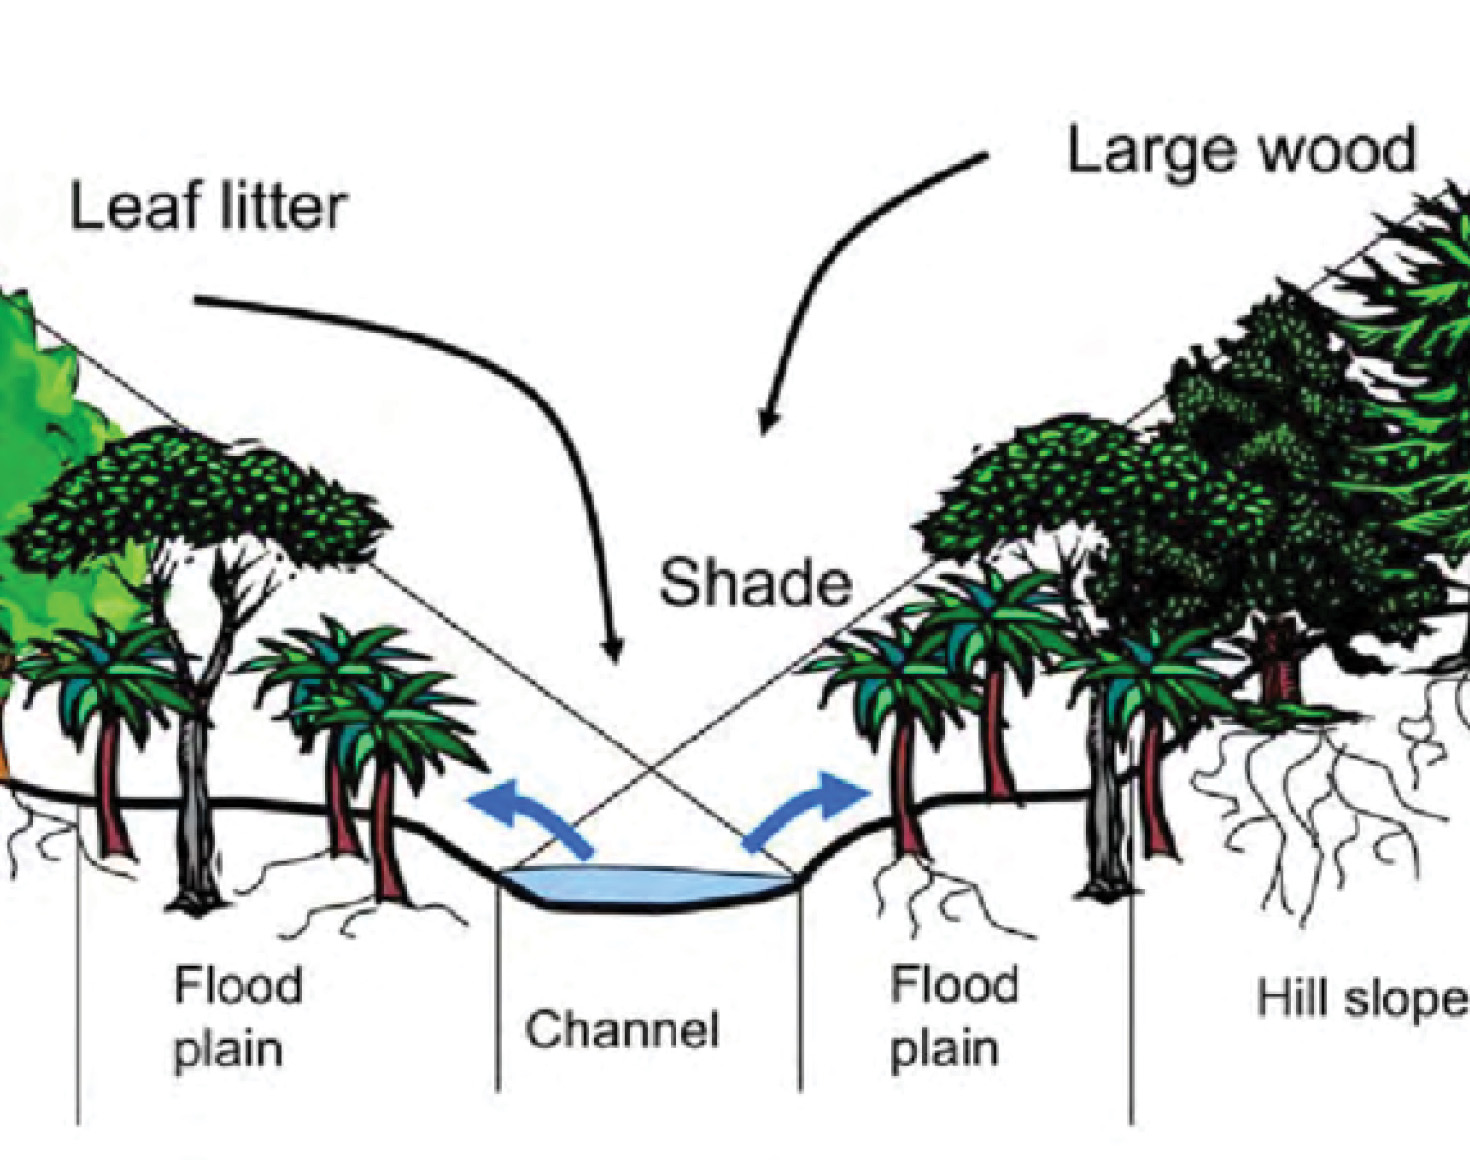
Mitigating the Urban Heat Island (UHI) effect around urban streams enhances cooling, biodiversity, and public health. Vegetated riparian zones reduce temperatures through shading and evapotranspiration. Integrating blue-green infrastructure is vital for climate resilience in Dresden, especially around these streams (Bowler et al., 2010).
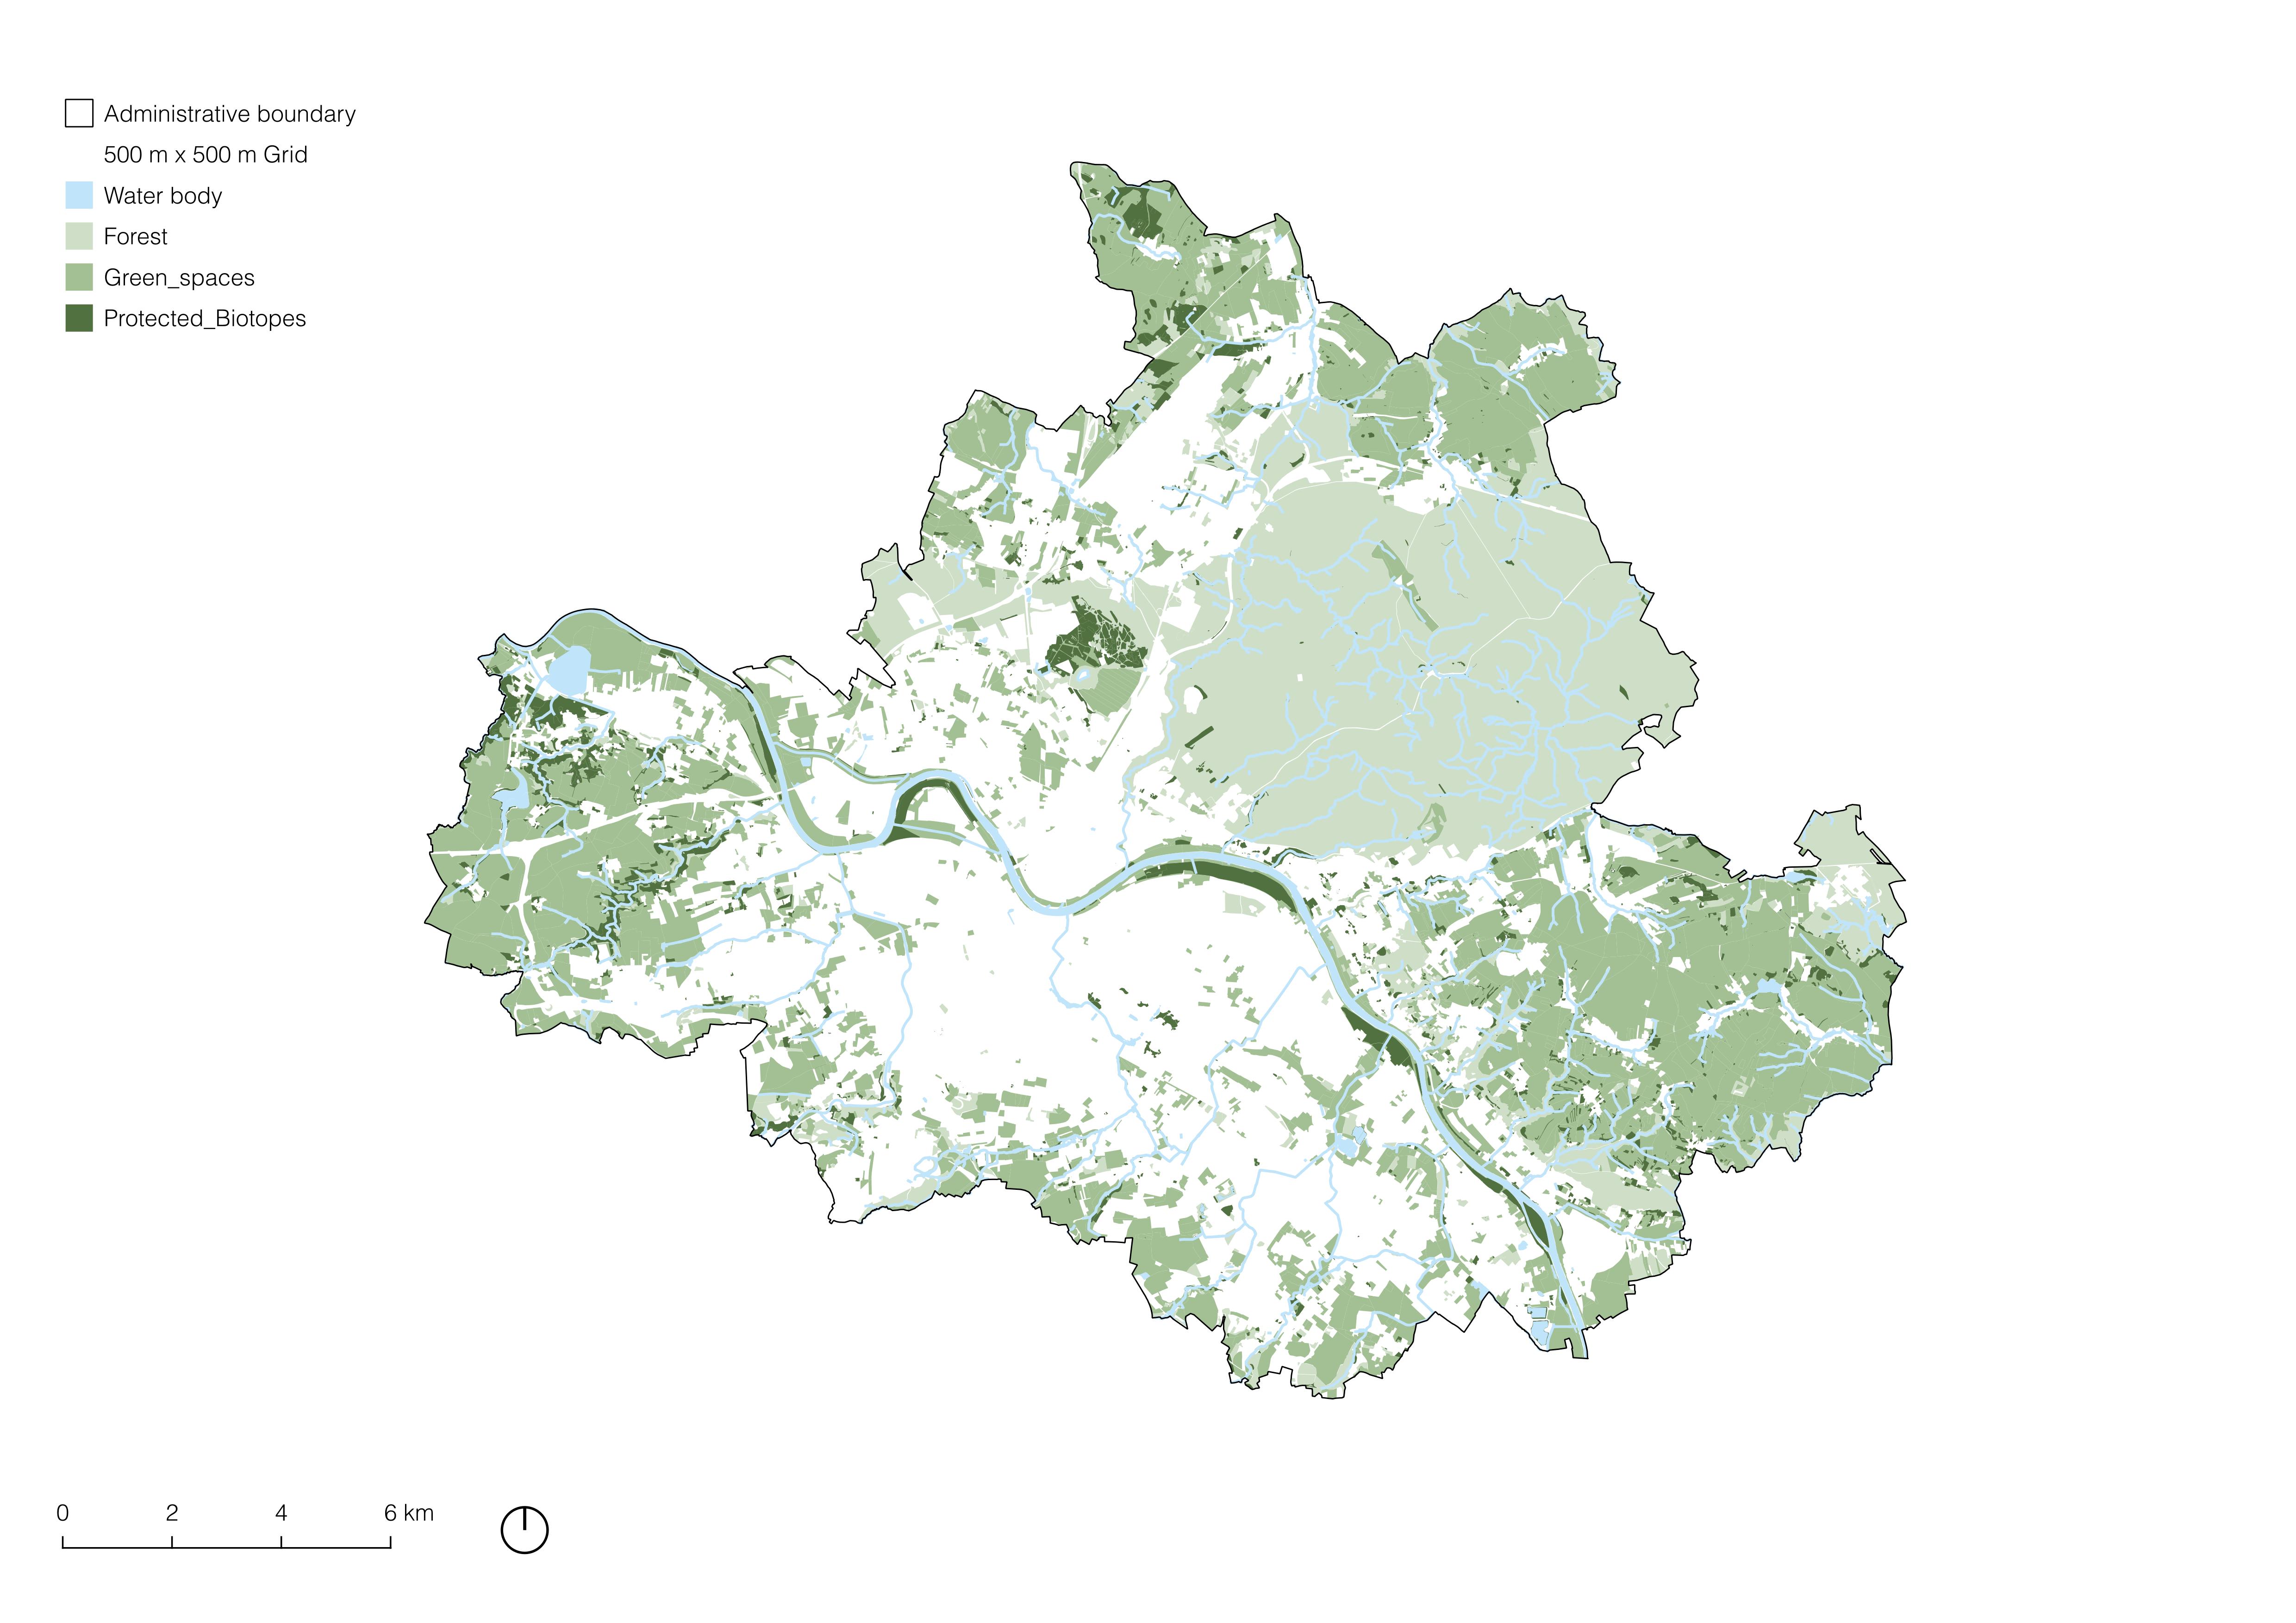
3.2.3 Green Cover: Green Spaces
According to Grunewald et al. (2019), urban green spaces should be within 300 to 500 meters of residential areas to maximise accessibility and benefits. To ensure that green-blue infrastructure is within 500 meters’ reach of residents, the streams which have green urban spaces within 500 meters are highlighted. They further overlap with the grid, highlighting spaces where residents can access green urban spaces. The ones indicated in a darker colour indicate that better green-blue integration techniques are needed.
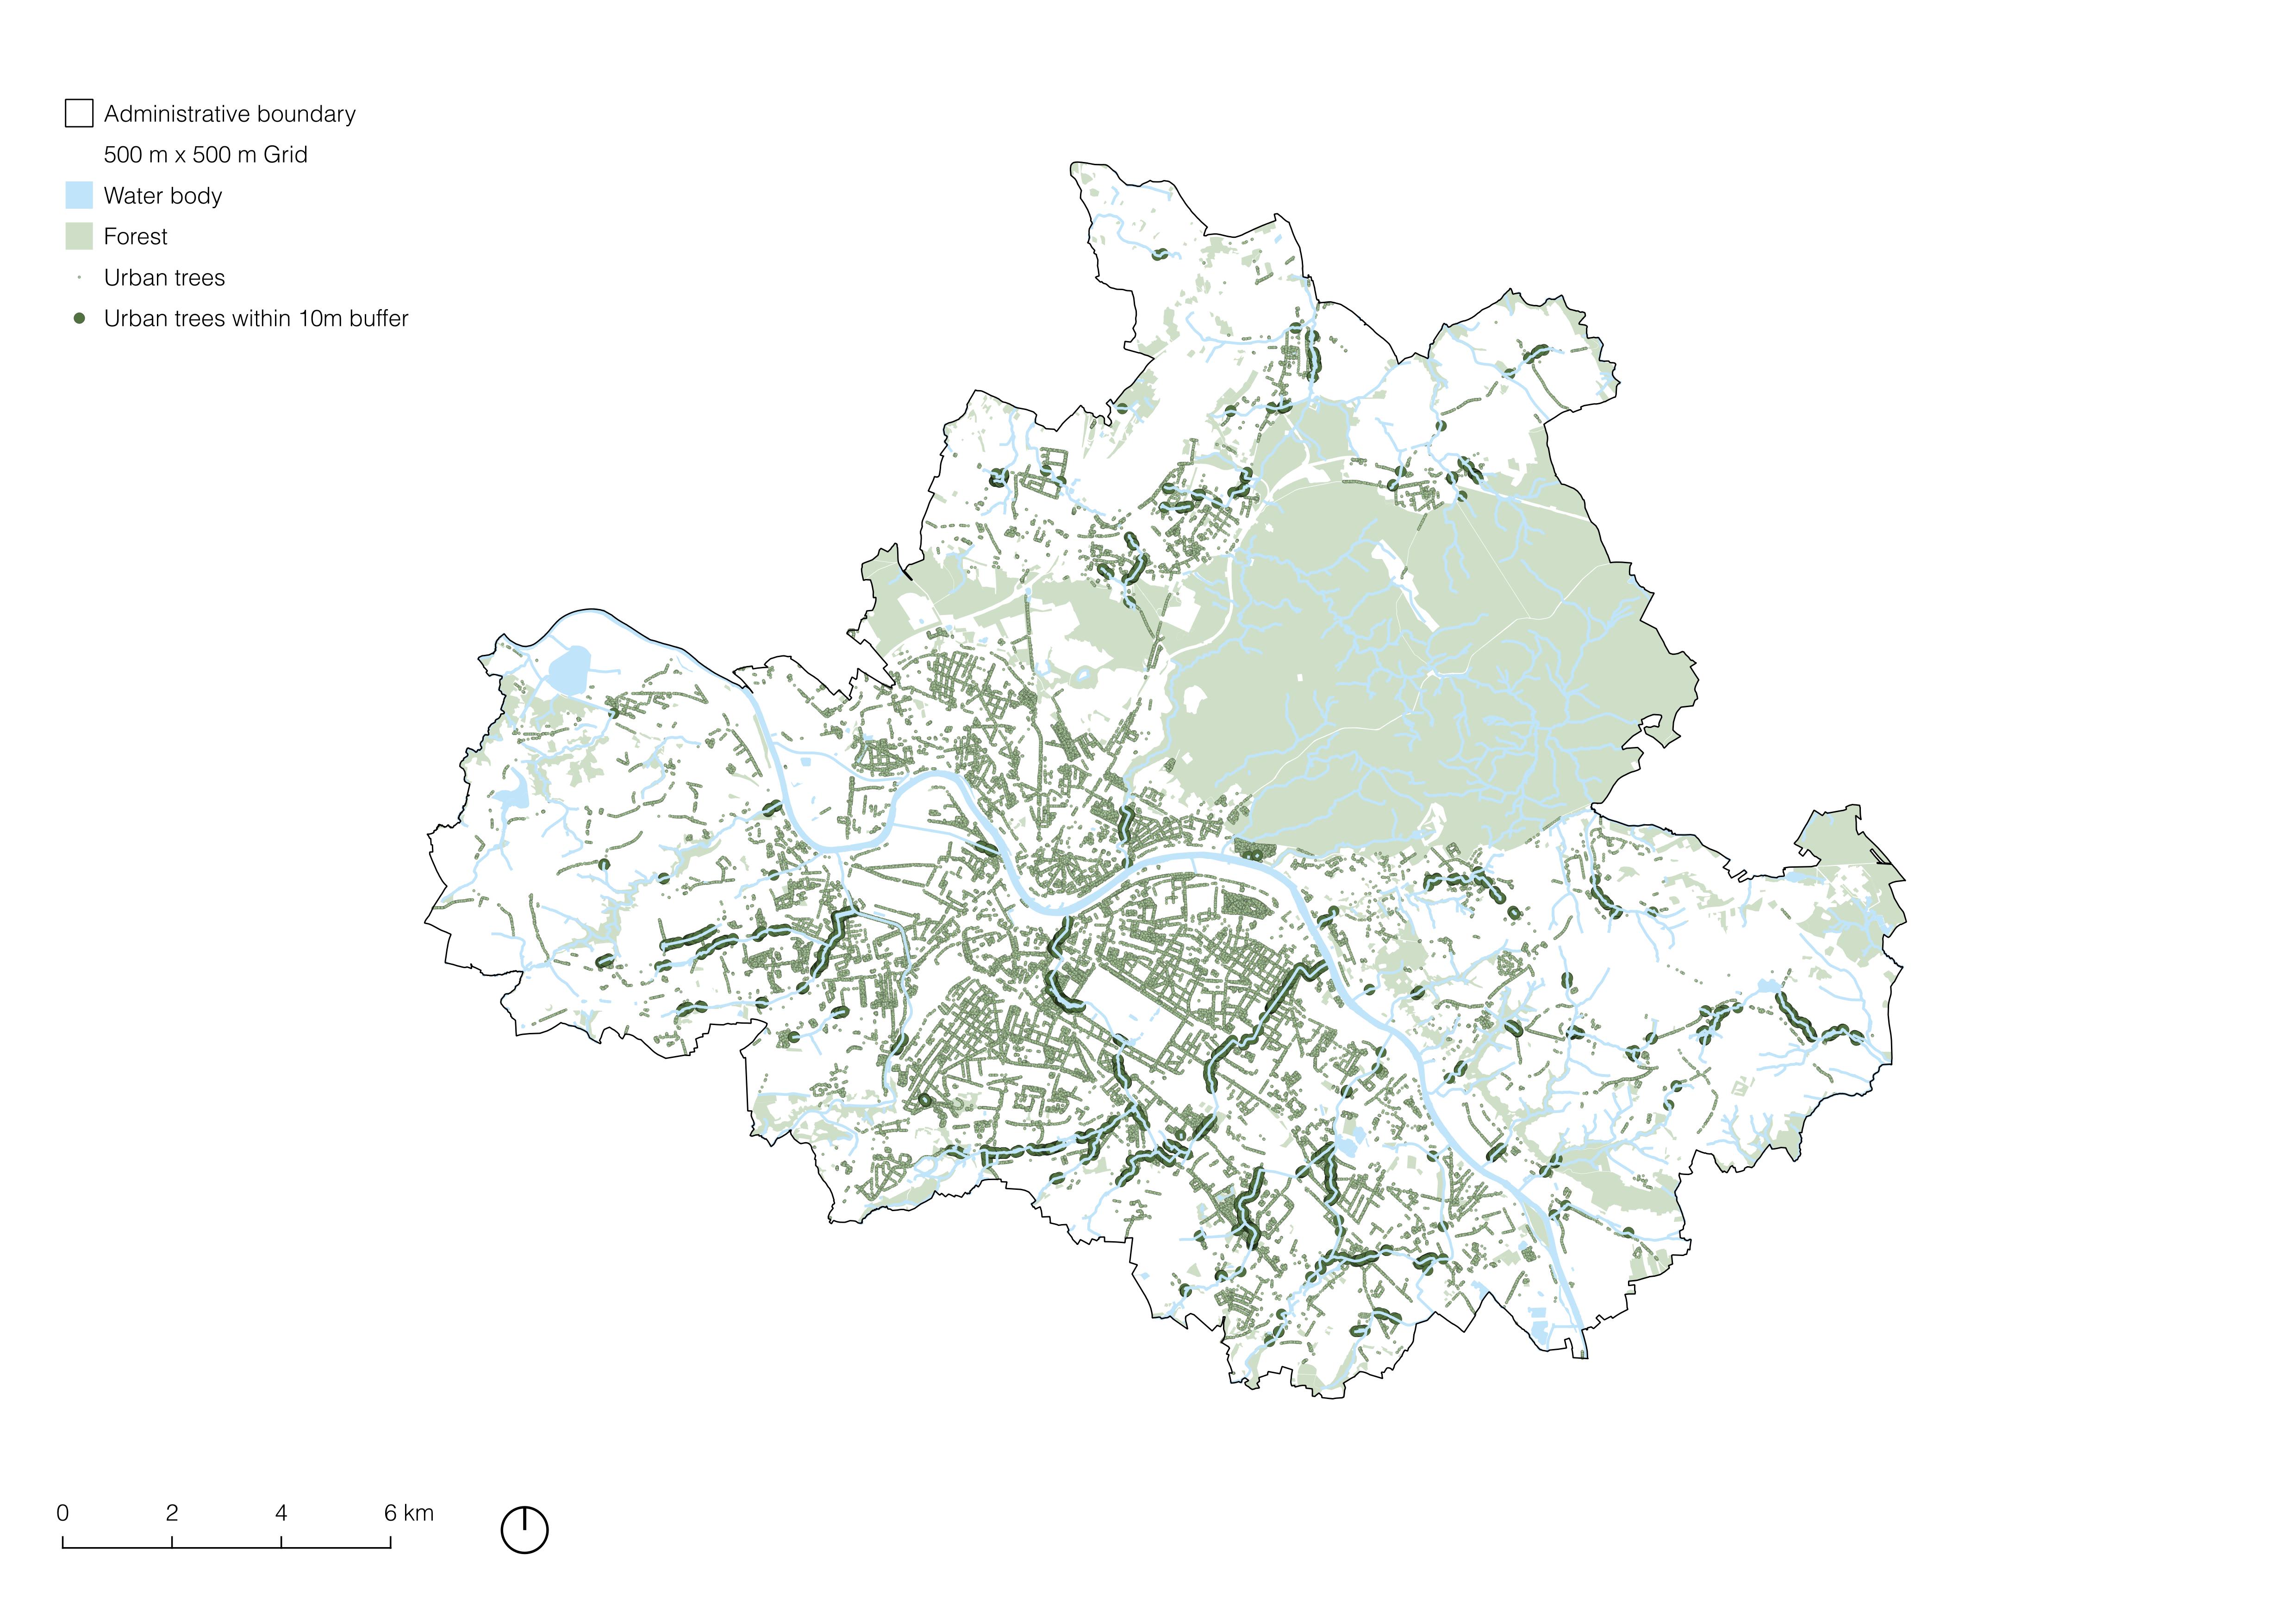
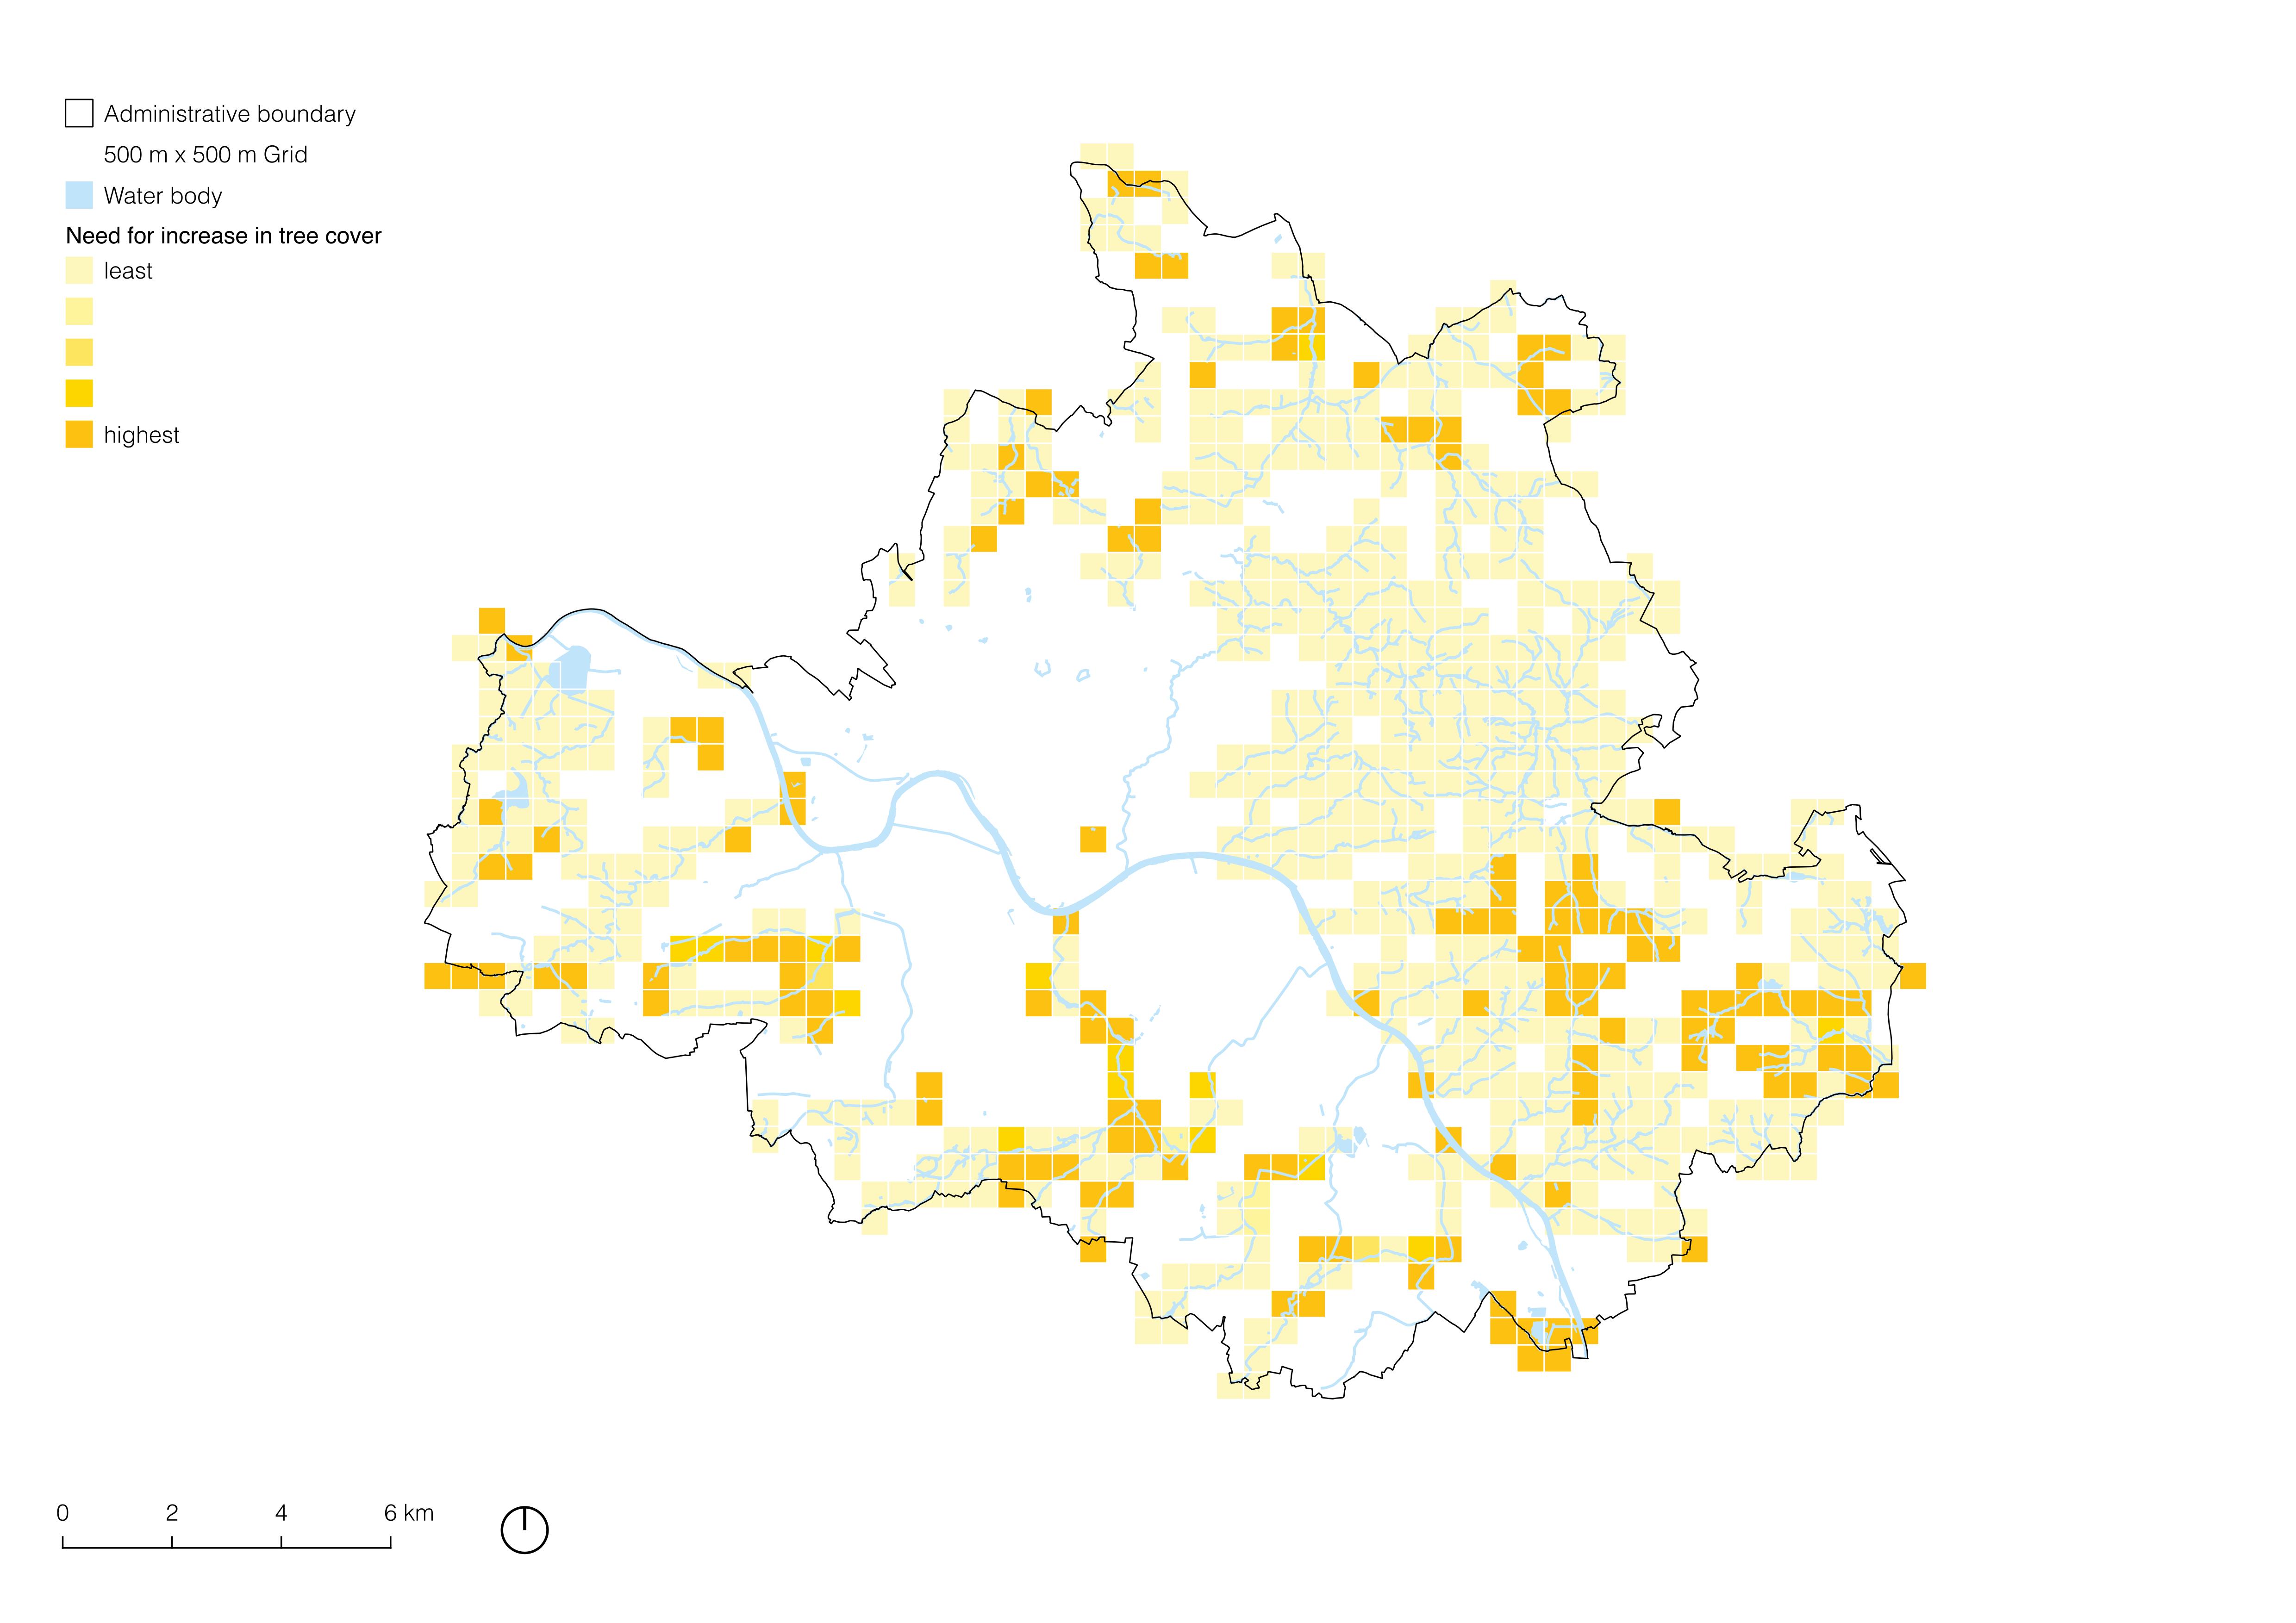
3.2.4 Green Cover: Urban Trees
Urban trees in Dresden can offer substantial benefits, including mitigating the urban heat island effect, enhancing air quality, and supporting biodiversity. While there are many trees in the city in general, many urban streams are not surrounded by trees. Challenges such as climate-induced drought stress, increased susceptibility to pests, and limited space in densely built areas thus arise and necessitate careful species selection and strategic planning to ensure the resilience and effectiveness of urban forestry initiatives (Adamska, 2013).
The article by Adamska (2013) suggests that the first zone of the riparian zone around urban streams and rivers should be covered with trees, and this zone should be at least 10 meters wide, because it allows roots to hold soil and reduce erosion. Overhanging trees reduce water temperature and support aquatic life. Hence, a buffer of 10 meters was created around the urban streams. The trees within this buffer were given a value of 1, and the count was categorised based on the stream grid overlaid. The ones with a value of 2 and above require planting native shrubs and deep-rooted trees to reduce erosion and enhance biodiversity.
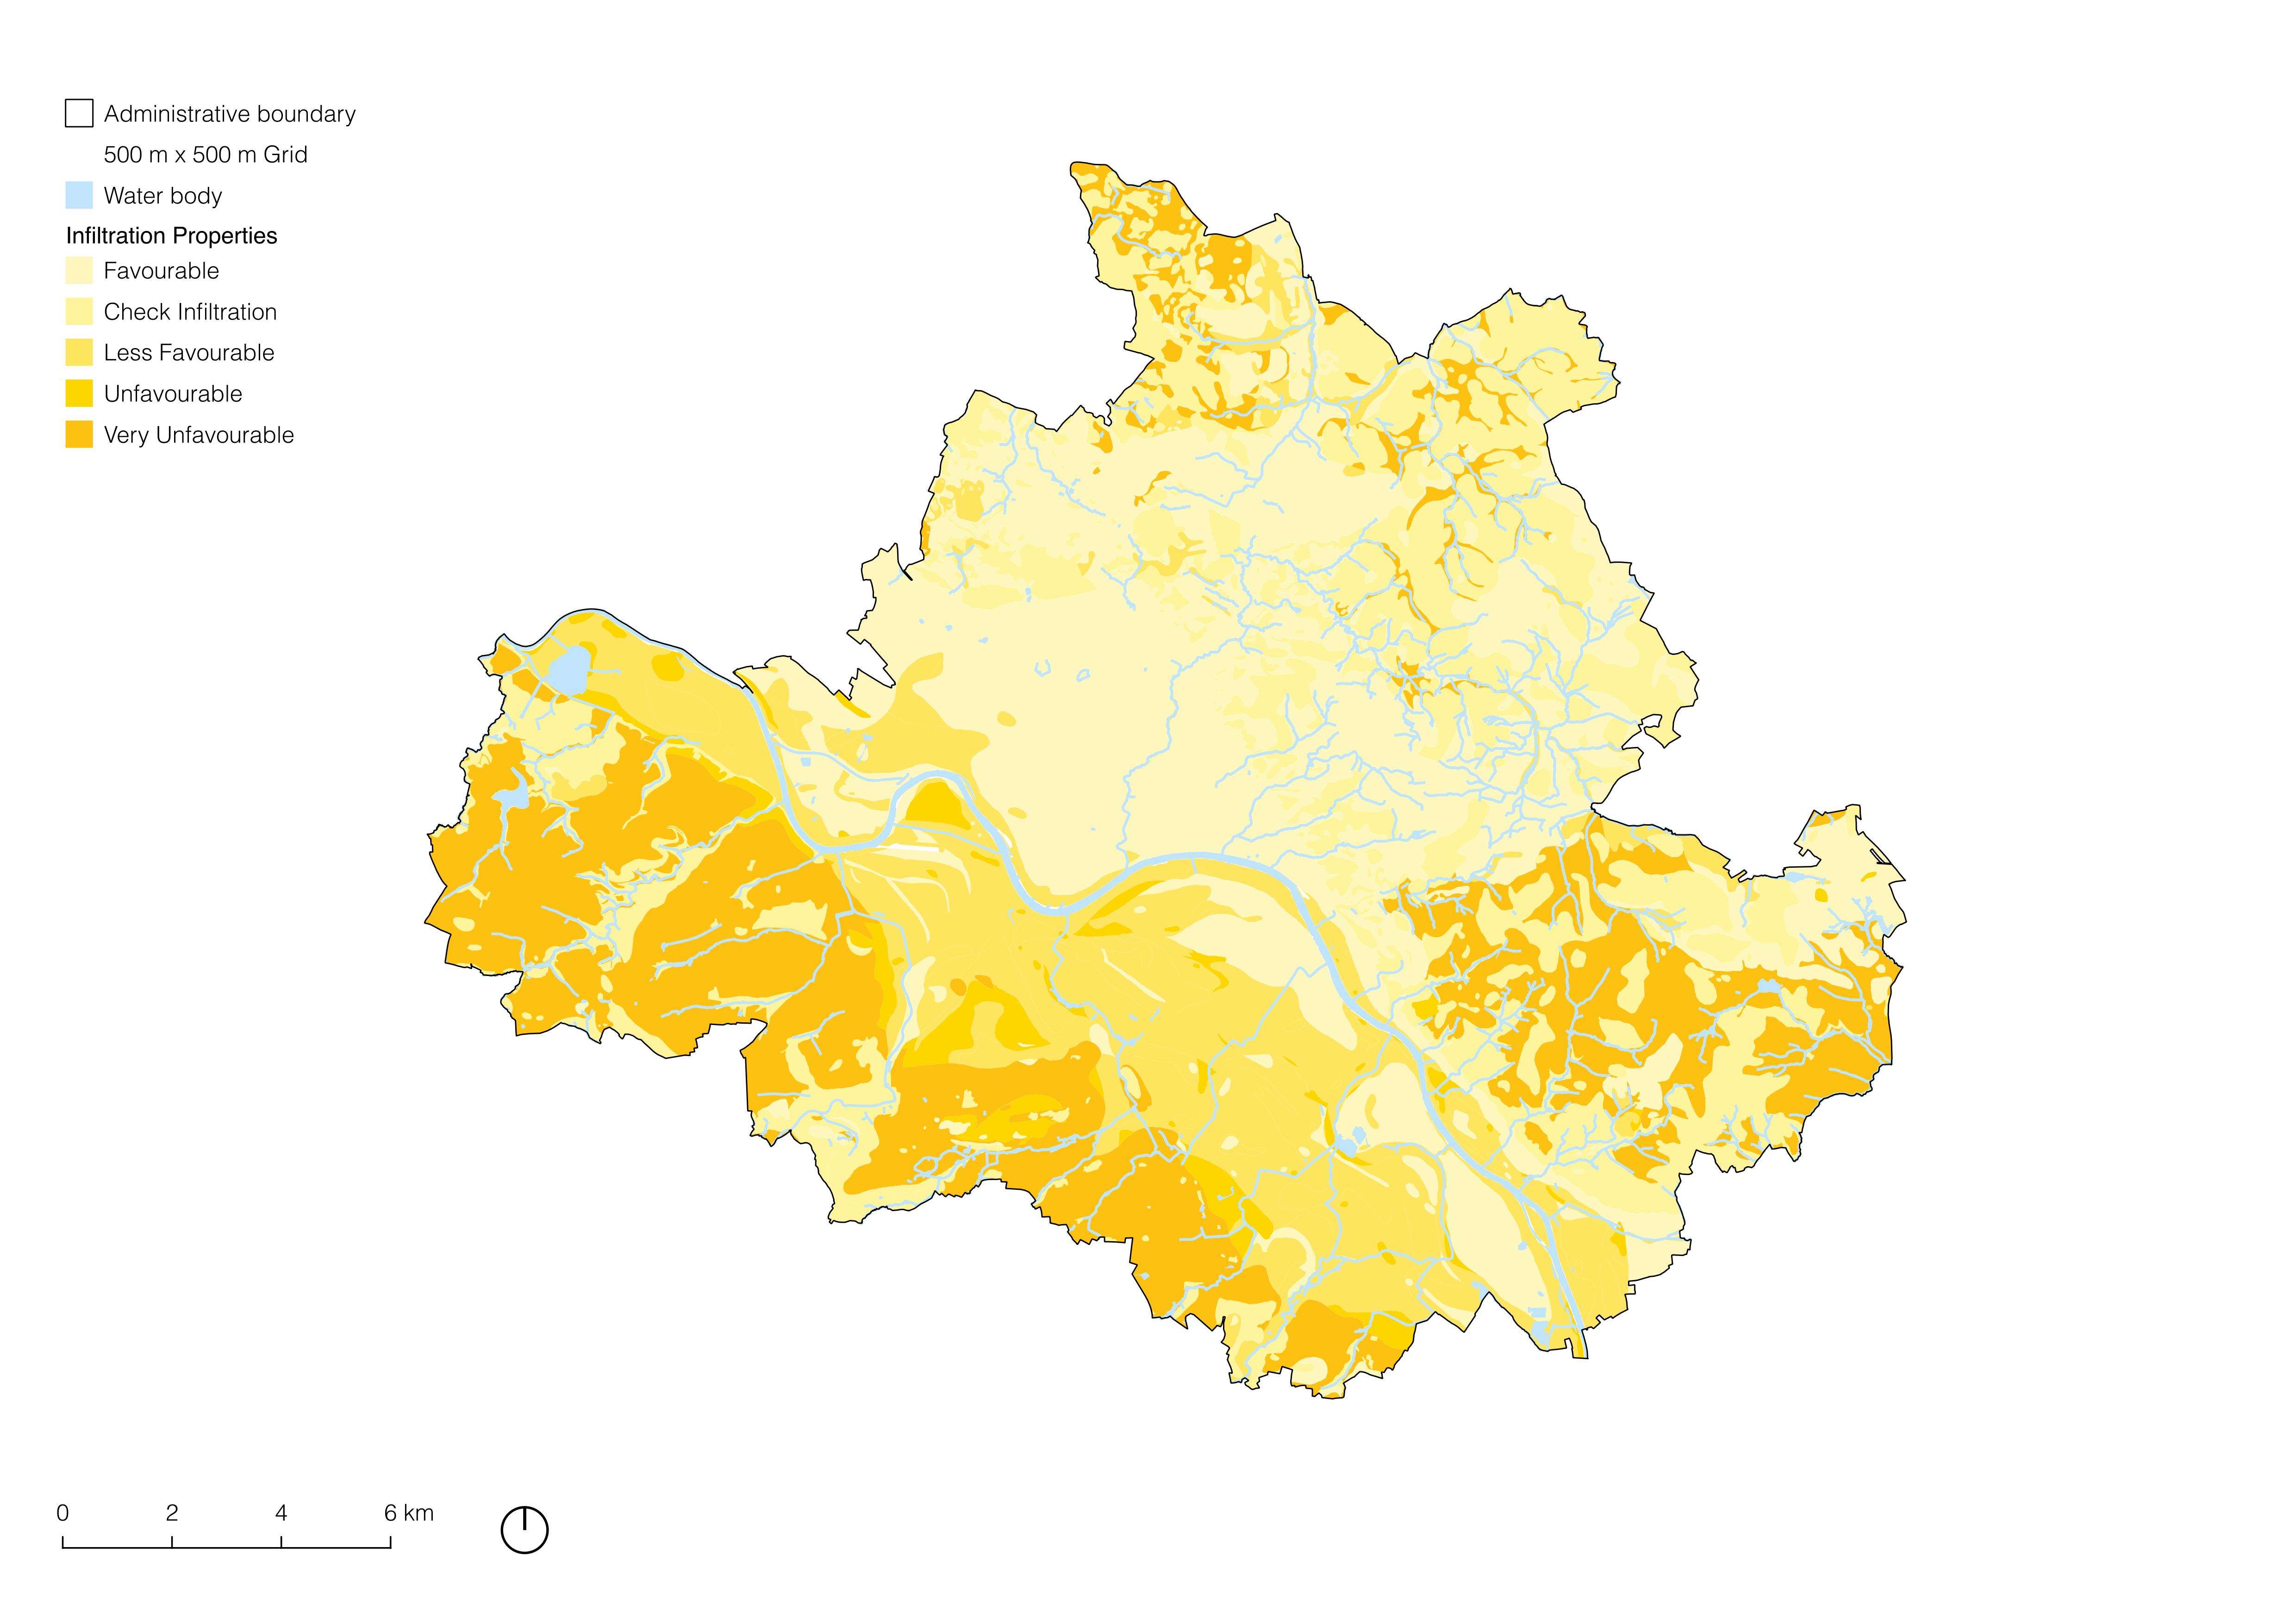
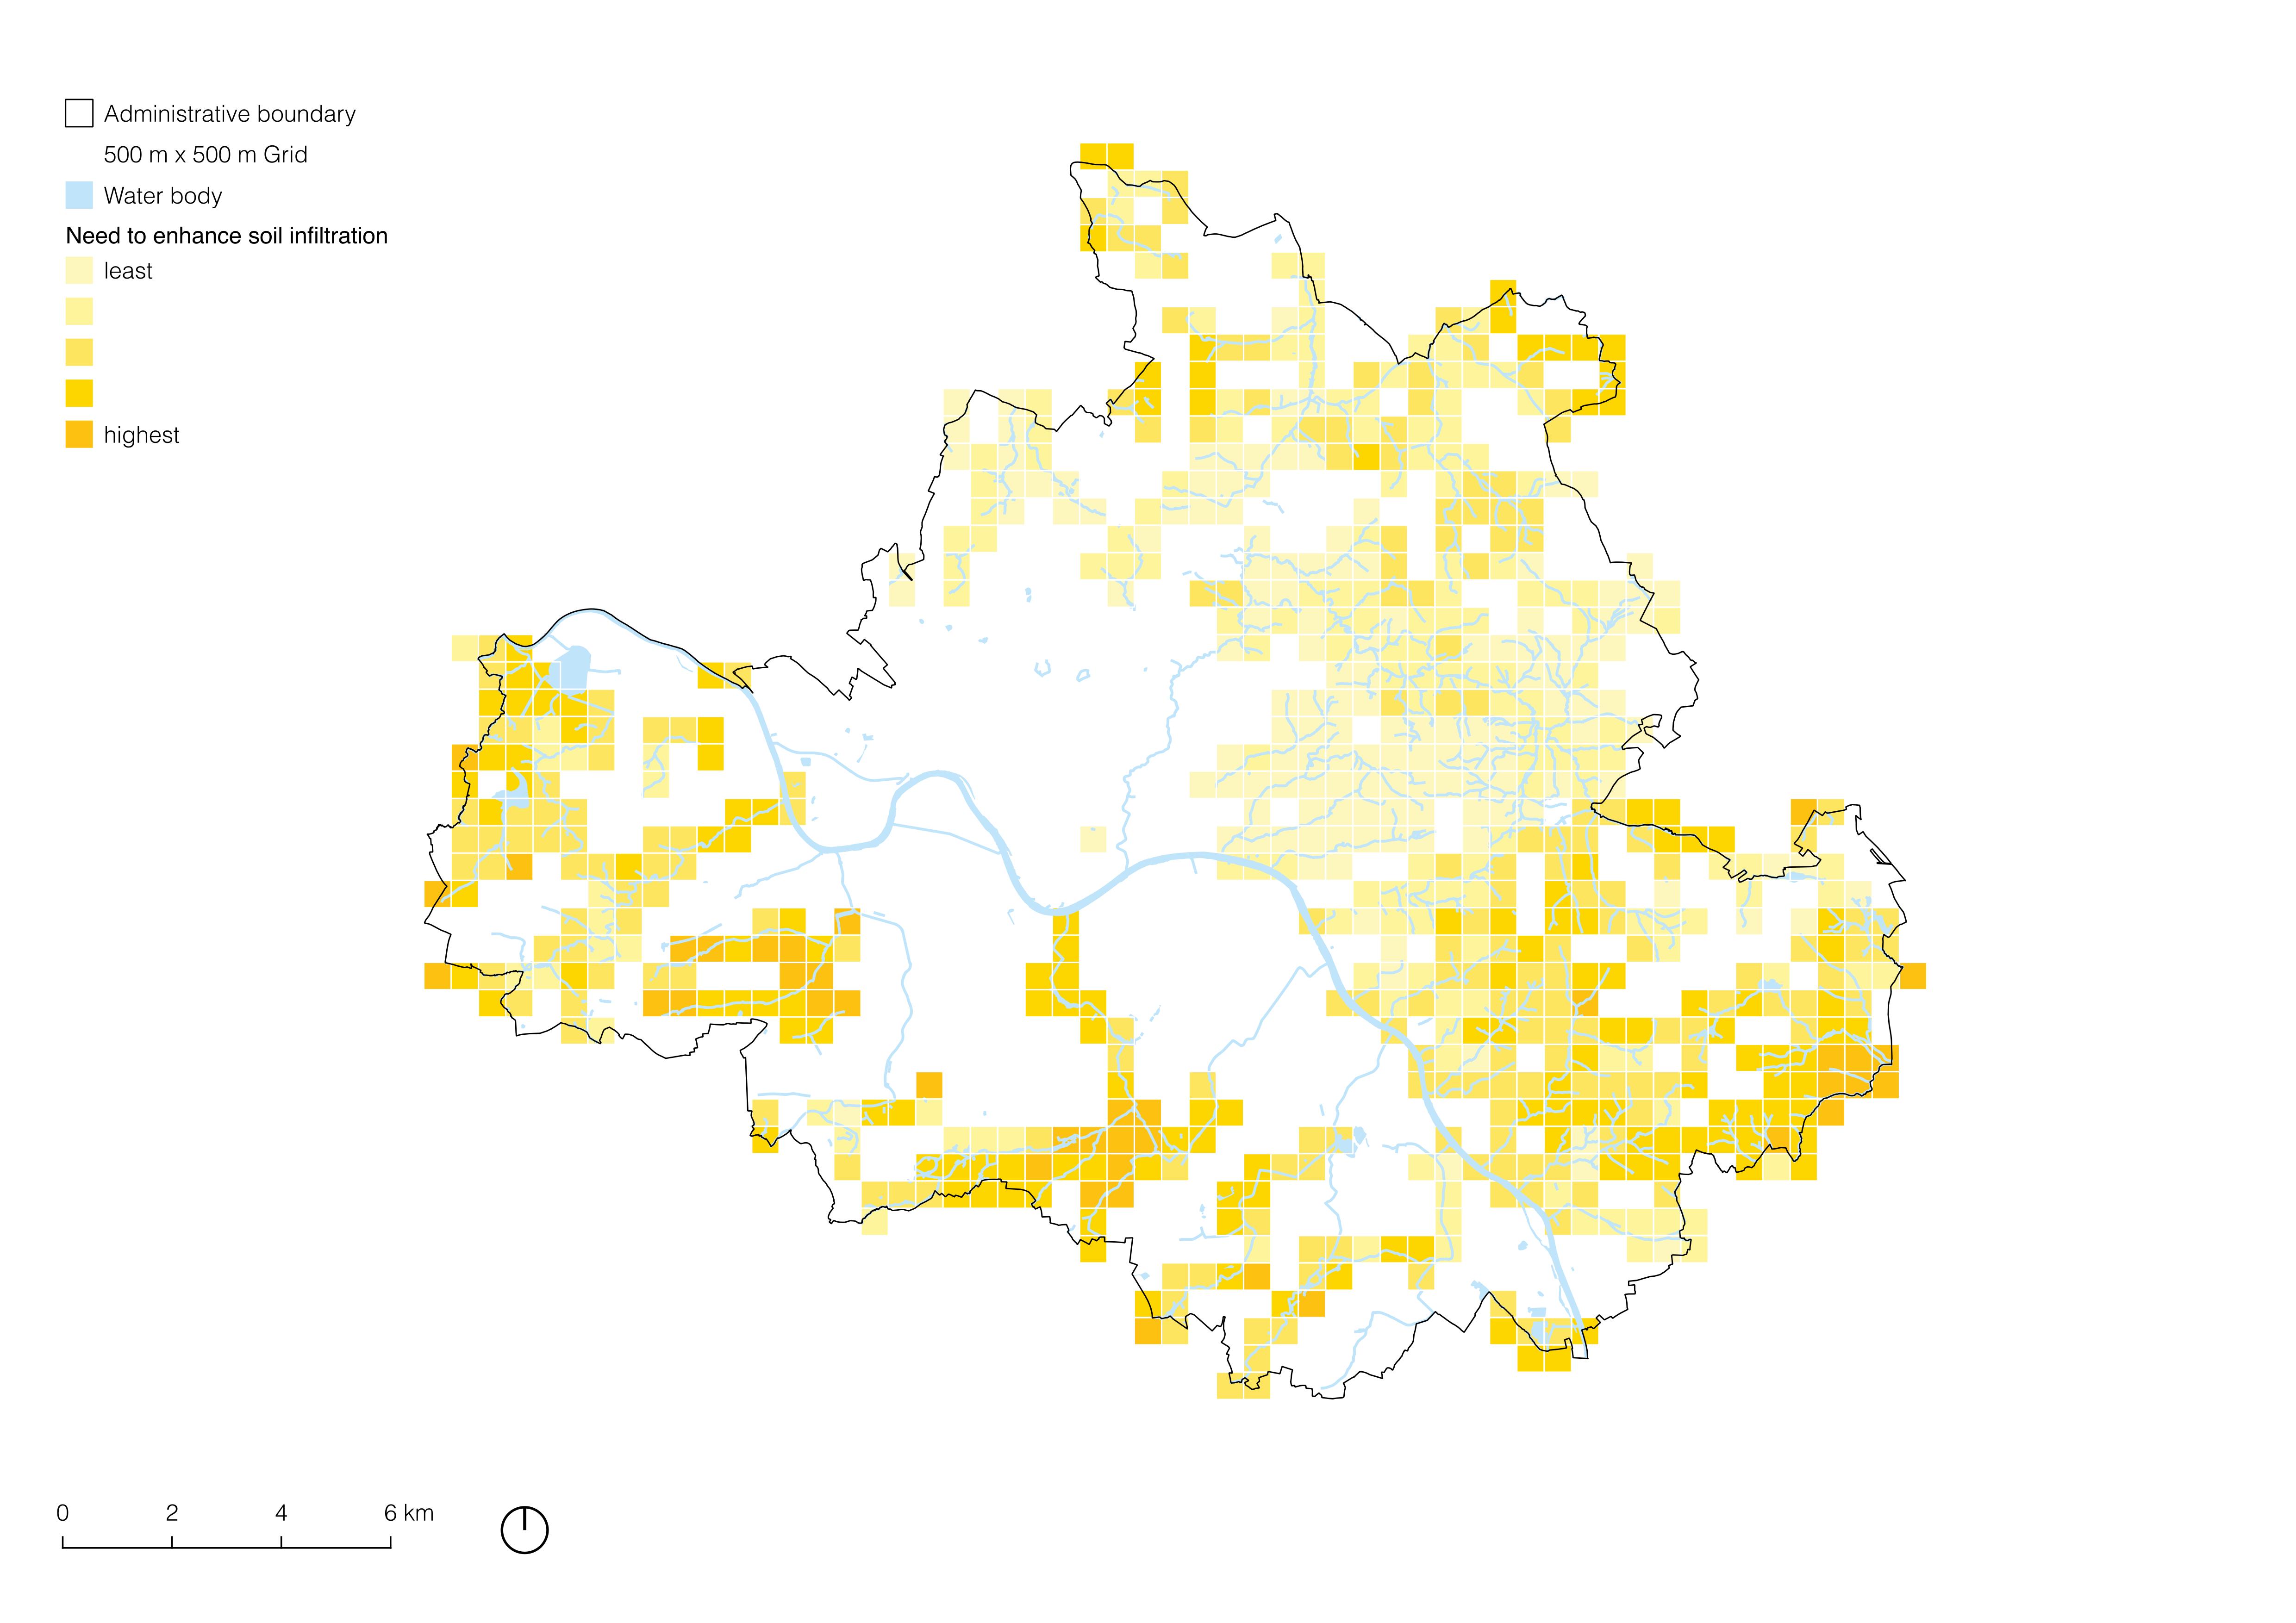
3.2.5 Infiltration Properties: Seepage
Located along the Elbe River, Dresden has experienced severe flooding in recent decades, most notably during the 2002 flood disaster. With climate projections indicating more intense and frequent storm events in the region (Reporter, 2002), improving infiltration around urban streams is essential. Enhanced infiltration reduces surface runoff, delays peak discharge, and alleviates the burden on stormwater infrastructure, thereby mitigating flood risks in densely built-up areas.
The areas with “infiltration favourable” were given a value of 1, as they function well in their infiltration capacity. The rest of the areas with the infiltration range from less favourable to highly unfavourable were given the value 5. Further, the grid with urban streams was overlapped, and the mean count was ascribed to each grid as each included a range of values. These areas (grid) with values closer to 5 are thus to be considered for improving infiltration capacity and suitability immediately to help flood mitigation, reduce surface runoff (Fletcher et al., 2014), and improve water quality and ecosystem health.
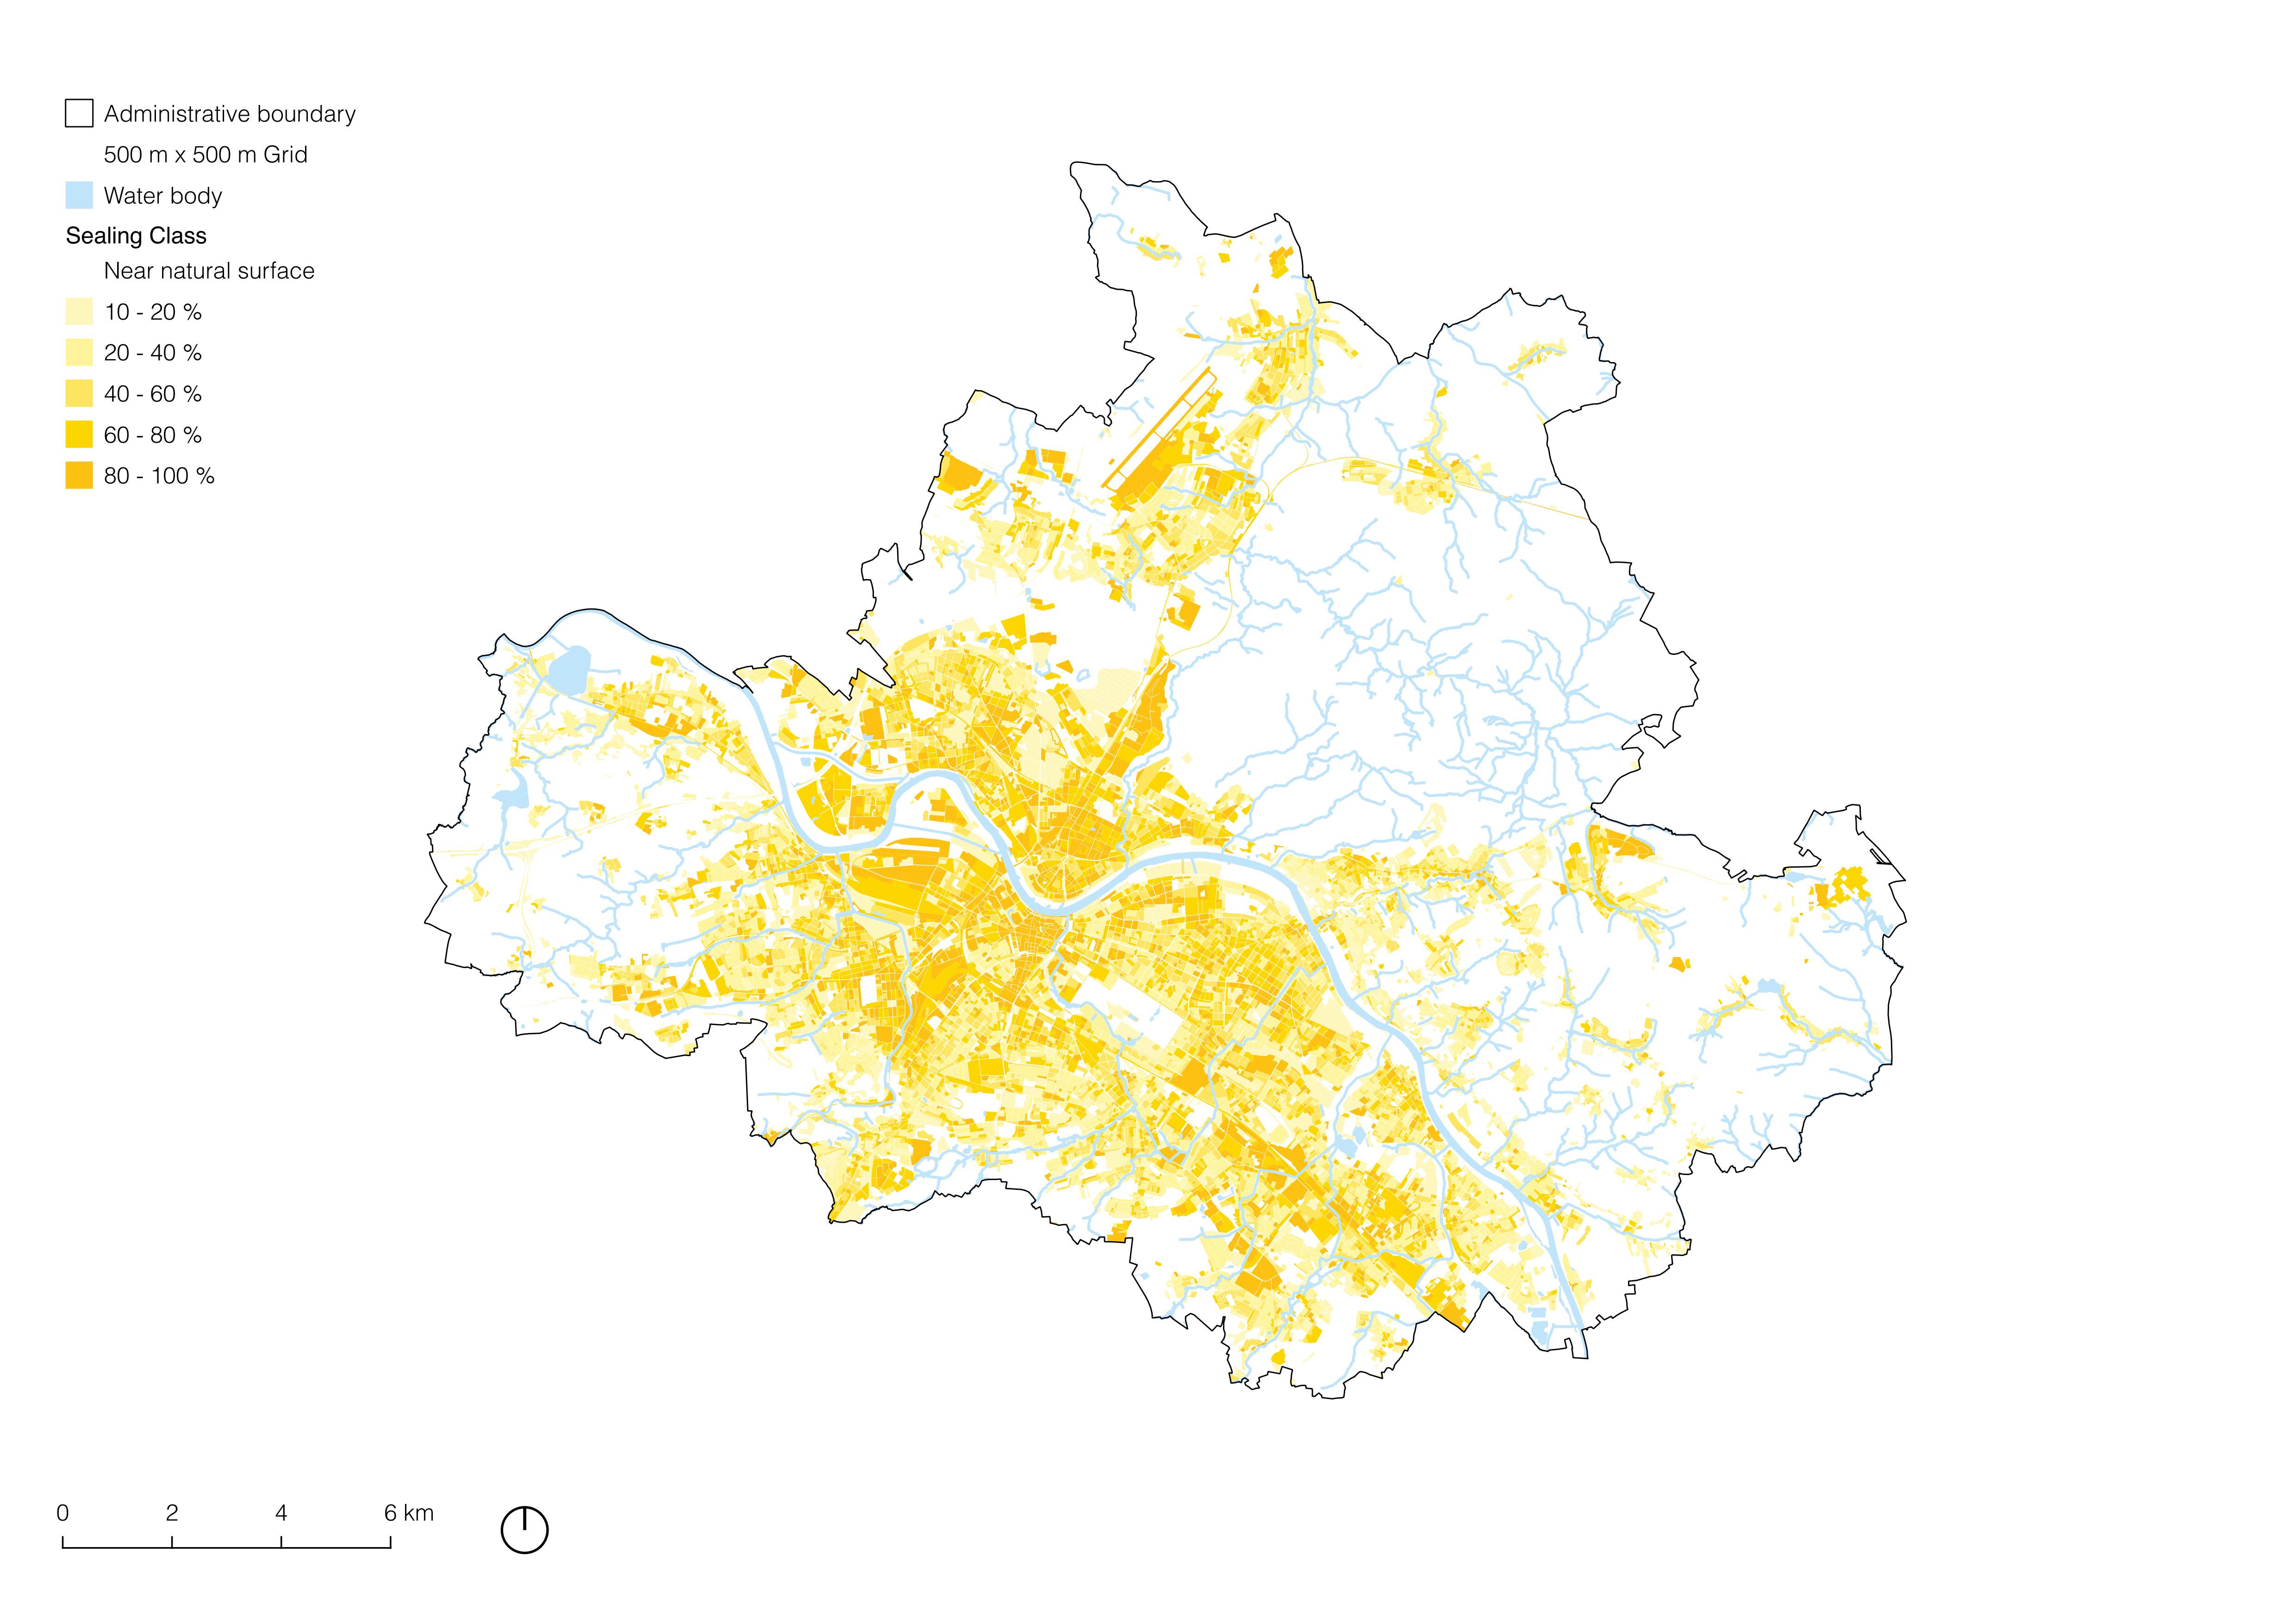
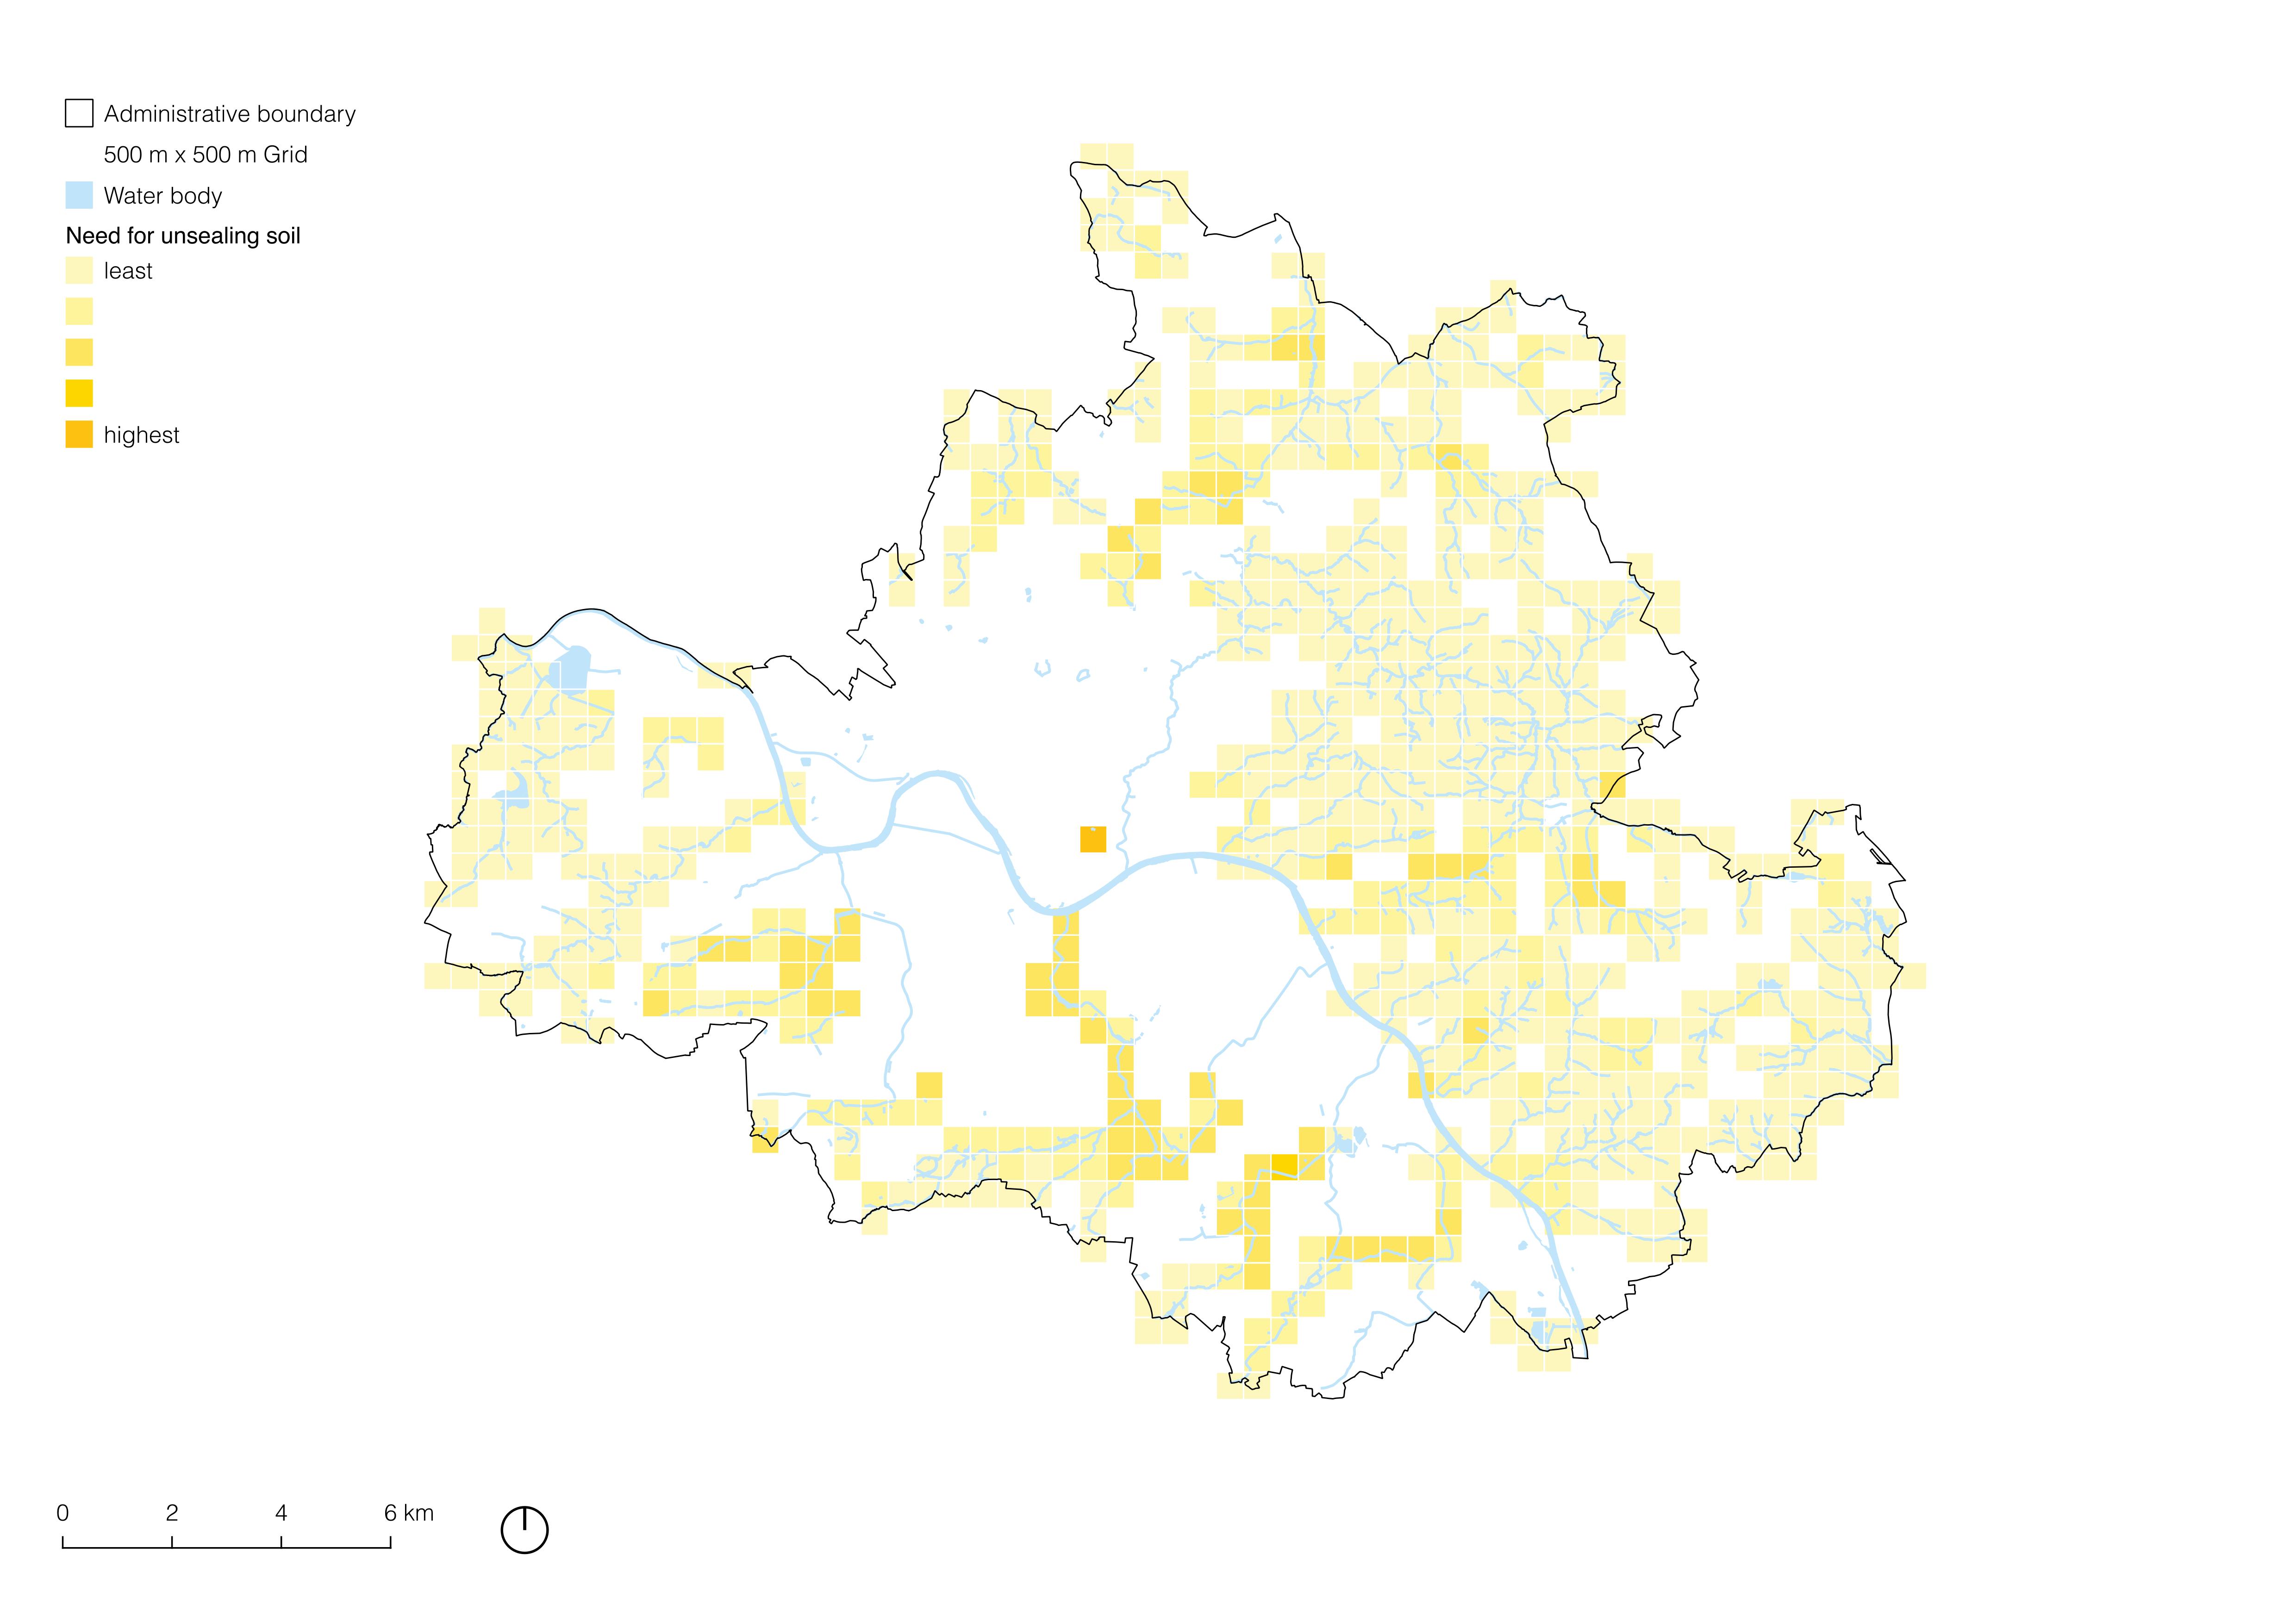
3.2.6 Infiltration Properties: Sealing Class
Sealing of urban surfaces generally becomes detrimental to urban stream health and requires alteration for restoration, even if the Versiegelungsgrad (VSG) exceeds 10% (Paul & Meyer, 2001). Studies indicate that impervious surface cover beyond this threshold leads to significant hydrological disruption, including increased runoff, reduced infiltration, and degraded water quality. The European Environment Agency (Kazmierczak et al., 2020) similarly highlights that urban areas with sealing rates above 20% often exhibit impaired stream function and require integrated green infrastructure interventions to restore hydrological and ecological balance. Thus, restoration efforts should prioritise reducing VSG in catchments exceeding this range.
Thus, the sealing classes were normalised from 1-5, and the unsealed areas were given a value of 1. The grid was overlaid, and the mean values were calculated to see which areas require immediate sealing alteration to restore urban streams.
3.2.7 Saaty Matrix
In order to compile the five different layers into a single map representing the climate adaptation in the city of Dresden, weights must be assigned to each layer. The variables infiltration properties and seepage properties have been given the highest priority. Sealing class and urban trees contribute to the previous two attributes, which is why they have been assigned a similar weight. UHI, while important, has been given a very minimal weight in the analysis, as it does not contribute as significantly to flood mitigation as the other attributes.
3.3 Biodiversity
Biodiversity is important because it underpins ecosystem health, providing vital services such as air purification, water filtration, and climate regulation, all of which are essential for the well-being of urban environments and human populations. Promoting and enhancing biodiversity is a core goal of the Urban Stream Restoration project.
3.3.1 PM10
Airborne particulate matter, specifically PM10 (particulate matter with a diameter of 10 micrometers or less), is a significant air pollutant that can negatively impact environmental health and biodiversity. High concentrations of PM10 can stress ecosystems and reduce overall ecological quality. To assess this, PM10 values were measured by the municipality of Dresden. On the normalized 0-1 scale, a value of 0 indicates PM10 pollution greater than 45 µg/m², representing the worst conditions, while 1 signifies 0 µg/m² PM10 pollution, indicating the best conditions for biodiversity. These values were derived by regridding the municipality’s per-tile data onto the new 500x500m grid, with overlaying tiles weighted by their area, and then rescaled from 45-0 µg/m² to 0-1 to ensure that higher values are more favourable.
Click to show/hide the SQL code for the normalisation calculation
round(1 - ("Weighted_PM10_AreaPollution" / 45), 3)
3.3.2 NO₂
Similar to PM10, Nitrogen Dioxide (NO₂) concentration is another critical indicator of air quality that directly influences biodiversity within urban landscapes. Elevated NO₂ levels contribute to air pollution, which can harm vegetation and aquatic life, thereby degrading the ecological value of an area. For this analysis, NO₂ values collected and released by the municipality of Dresden were used. On the 0-1 normalized scale, a value of 0 represents NO₂ pollution greater than 40 µg/m², signifying poor conditions for biodiversity, whereas 1 indicates 0 µg/m² NO₂ pollution, representing optimal conditions. The methodology for determining and normalizing these values was identical to that used for PM10, involving regridding and rescaling from a 40-0 µg/m² range to 0-1.
Click to show/hide the SQL code for the normalisation calculation
round(1 - ("Weighted_NO2_AreaPollution" / 40), 3)
3.3.3 NDVI
The Normalized Difference Vegetation Index (NDVI) is a crucial metric for assessing vegetation density and health, directly reflecting the extent and quality of green spaces that support urban biodiversity. A higher NDVI indicates more robust vegetation, essential for healthy ecosystems and the numerous benefits they provide. The annual, average NDVI values were measured using data from the Copernicus satellite, spanning from May 2023 to May 2024. On the normalized 0-1 scale, a value of 0 denotes very poor NDVI, implying an absence of trees or significant vegetation, while 1 indicates very good NDVI, signifying a rich and healthy vegetative cover. The mean NDVI values, originally ranging from -1 to +1, were calculated and averaged over a year, then transformed to the 0-1 scale using the formula (x+1)/2, where x is the original NDVI value.
Click to show/hide the Python code for the NDVI calculation (not normalised yet)
// Import Dresden boundary from GEE's administrative dataset
var dresden = ee.FeatureCollection('FAO/GAUL/2015/level2')
.filter(ee.Filter.and(
ee.Filter.eq('ADM0_NAME', 'Germany'),
ee.Filter.eq('ADM2_NAME', 'Dresden')
));

// Create 1 km buffer around Dresden
var bufferDistance = 1000; // meters
var dresdenBuffered = dresden.geometry().buffer(bufferDistance);

// Define date range
var startDate = '2023-05-01';
var endDate = '2024-05-30';

// Load Sentinel-2 Surface Reflectance data
var s2 = ee.ImageCollection('COPERNICUS/S2_SR')
.filterBounds(dresdenBuffered)
.filterDate(startDate, endDate)
.filter(ee.Filter.lt('CLOUDY_PIXEL_PERCENTAGE', 20));

// Calculate NDVI
var addNDVI = function(image) {
var ndvi = image.normalizedDifference(['B8', 'B4']).rename('NDVI');
return image.addBands(ndvi);
};

var s2_ndvi = s2.map(addNDVI).select('NDVI');

// Calculate mean NDVI and clip to buffered Dresden
var meanNDVI = s2_ndvi.mean().clip(dresdenBuffered);

// Define color palette from light green (-1) to dark green (+1)
var ndviPalette = [
'd9f0d3', // light green for -1
'a6dba0',
'5aae61',
'1b7837', // dark green for +1
];

// Visualize mean NDVI with palette
Map.centerObject(dresdenBuffered, 11);
Map.addLayer(meanNDVI, {min: -1, max: 1, palette: ndviPalette}, 'Mean NDVI');

// Export as GeoTIFF to Google Drived
Export.image.toDrive({
image: meanNDVI,
description: 'Dresden_Mean_NDVI_May2023_May2024',
scale: 10,
region: dresdenBuffered,
maxPixels: 1e13
});
Click to show/hide the SQL code for the normalisation calculation
round((("NDVI" + 1)/ 2), 3)
3.3.4 Landscape Quality
The Landscape Quality Assessment, as classified by the municipality of Dresden, provides a direct evaluation of an area’s aesthetic and ecological value, both of which are integral to supporting biodiversity and creating healthy urban environments. This assessment helps identify areas where restoration efforts could significantly enhance natural beauty and ecological function. The quality of the landscape is represented on a 0-1 scale, where 0 indicates a very low value of the landscape, and 1 signifies a very high value of the landscape. Specific quality levels were assigned corresponding numerical values: “Very low quality” received 0.0, “Low quality” 0.25, “Medium quality” 0.5, “High quality” 0.75, and “Very high quality” or areas with “Unique aspects of the landscape or cityscape” were assigned 1.0. This metric was derived using a weighted average method.
Click to show/hide the SQL code for the normalisation calculation
CASE
  WHEN "bewertung" = 'Sehr geringe Wertigkeit' THEN 0.0
  WHEN "bewertung" = 'Geringe Wertigkeit' THEN 0.25
  WHEN "bewertung" = 'Mittlere Wertigkeit' THEN 0.5
  WHEN "bewertung" = 'Hohe Wertigkeit' THEN 0.75
  WHEN "bewertung" = 'Sehr hohe Wertigkeit' THEN 1.0
  WHEN "bewertung" = 'Einzigartige Aspekte des Landschafts- und Stadtbildes' THEN 1.0
  ELSE NULL
END
3.3.5 Blue-Green Infrastructure Percentage
The Percentage of Green or Blue Infrastructure within a grid cell directly quantifies the presence of natural elements crucial for urban biodiversity and overall ecological resilience. Integrating such spaces aligns with Dresden’s vision of a “compact city within an ecological network,” enhancing air and water quality, reducing urban heat island effects, and bolstering biodiversity. This metric represents the netto percentage of a grid cell whose land type is classified as green or blue. A value of 0 means 0% of the tile is classified as green or blue, indicating minimal natural elements, while 1 means 100% of the tile’s land type is green or blue, representing full natural coverage. This percentage was calculated as a weighted average value, utilizing the Bruto block land use classification from the municipality but applying it to the netto block map to specifically exclude non-green/blue areas like roads.
3.3.6 Saaty Matrix
To combine the five distinct layers into a single representation of biodiversity in Dresden, specific weights were assigned to each, as shown in the Saaty Matrix. The Landscape Quality Assessment and the Normalised Difference Vegetation Index (NDVI) were given the highest priority, as they directly reflect both the aesthetic and ecological value, as well as the health and extent of green spaces important for supporting urban biodiversity. The Blue-Green Infrastructure Percentage was also given significant weight, as it measures the presence of natural features essential for ecological resilience and supports Dresden’s integrated urban development goals. In contrast, PM10 and NO₂ concentrations—while recognised as important indicators of air quality that can harm biodiversity—were given less weight in this analysis, they are important, but were assessed/viewed in the sense of the result of the aforementioned layers.
3.4 Overview of the normal distribution of our layers
To help visualise and get a better understanding of the distribution of our values across our datasets, we’ve made the following plot which displays the distribution of the normalised values for all the layers used in the saaty matrices, and the resulting distribution per theme.
3.5 Interactive Map Dashboard
We’ve also developed an interactive dashboard that allows you to explore our urban stream restoration analysis in detail. Within the dashboard, you can view individual map layers or overlay any combination of layers, taking into account their importance or weights as defined in our S-MCDA analysis. For example, you might combine two BIO layers with one QOL layer to identify relationships and patterns. To support this flexibility, the dashboard includes a trivariate choropleth legend, enabling any combination of layers to be visualised.
Additionally, you can click on any 500 × 500 m grid tile to display a bar chart showing all attribute values (ranging from 0 to 1) for that specific location. This tool is particularly valuable for deeper analysis and informed decision-making, helping to prioritise which stream sections should be restored first and identifying the specific improvements needed for each tile.
3.5.1 How to use the dashboard
Unfortunately, due to CORS restrictions, you cannot open the dashboard by simply opening the HTML file. Fortunately, setting up a temporary local server is quite straightforward:
Prerequisite: Python must be installed on your computer.
Open your command prompt/terminal and navigate to the project directory:
cd C:\Users\daans\Documents\GitHub\report-asa2025-groupeUsing the same terminal window, start a local server hosted by the terminal:
python -m http.serverorpython3 -m http.server(depends on your python installation)Open your web browser and navigate to
localhost:8000/interactive%20map/
3.6 Weighted maps per theme
The following maps visualise the weighted results for the three core objectives of the Urban Stream Restoration project: Quality of Life, Climate Adaptation and Biodiversity. Each map is its own spatial assessment of how urban stream sections currently perform, and where improvement is most suitable per theme.
Click to show/hide the SQL code for the normalisation calculations, per theme
round(
  ("QOL_VicinityToUrbanGreenSpaces" * 0.342) +
  ("QOL_VicinityToStreams" * 0.32) +
  ("QOL_Facilities" * 0.172) +
  ("QOL_LocalIntegration" * 0.125) +
  ("QOL_CoveredStreamDistance" * 0.04),
3)

round(
  ("CLI_Infiltration" * 0.39) +
  ("CLI_SealingClass" * 0.283) +
  ("CLI_SoilStorage" * 0.132) +
  ("CLI_UrbanHeatIsland" * 0.063) +
  ("CLI_UrbanTrees" * 0.132),
3)

round(
  ("CLI_Infiltration" * 0.39) +
  ("CLI_SealingClass" * 0.283) +
  ("CLI_SoilStorage" * 0.132) +
  ("CLI_UrbanHeatIsland" * 0.063) +
  ("CLI_UrbanTrees" * 0.132),
3)

round((BIO_Weighted + QOL_Weighted + CLI_Weighted)/3,3)
3.7 Weighted overall map
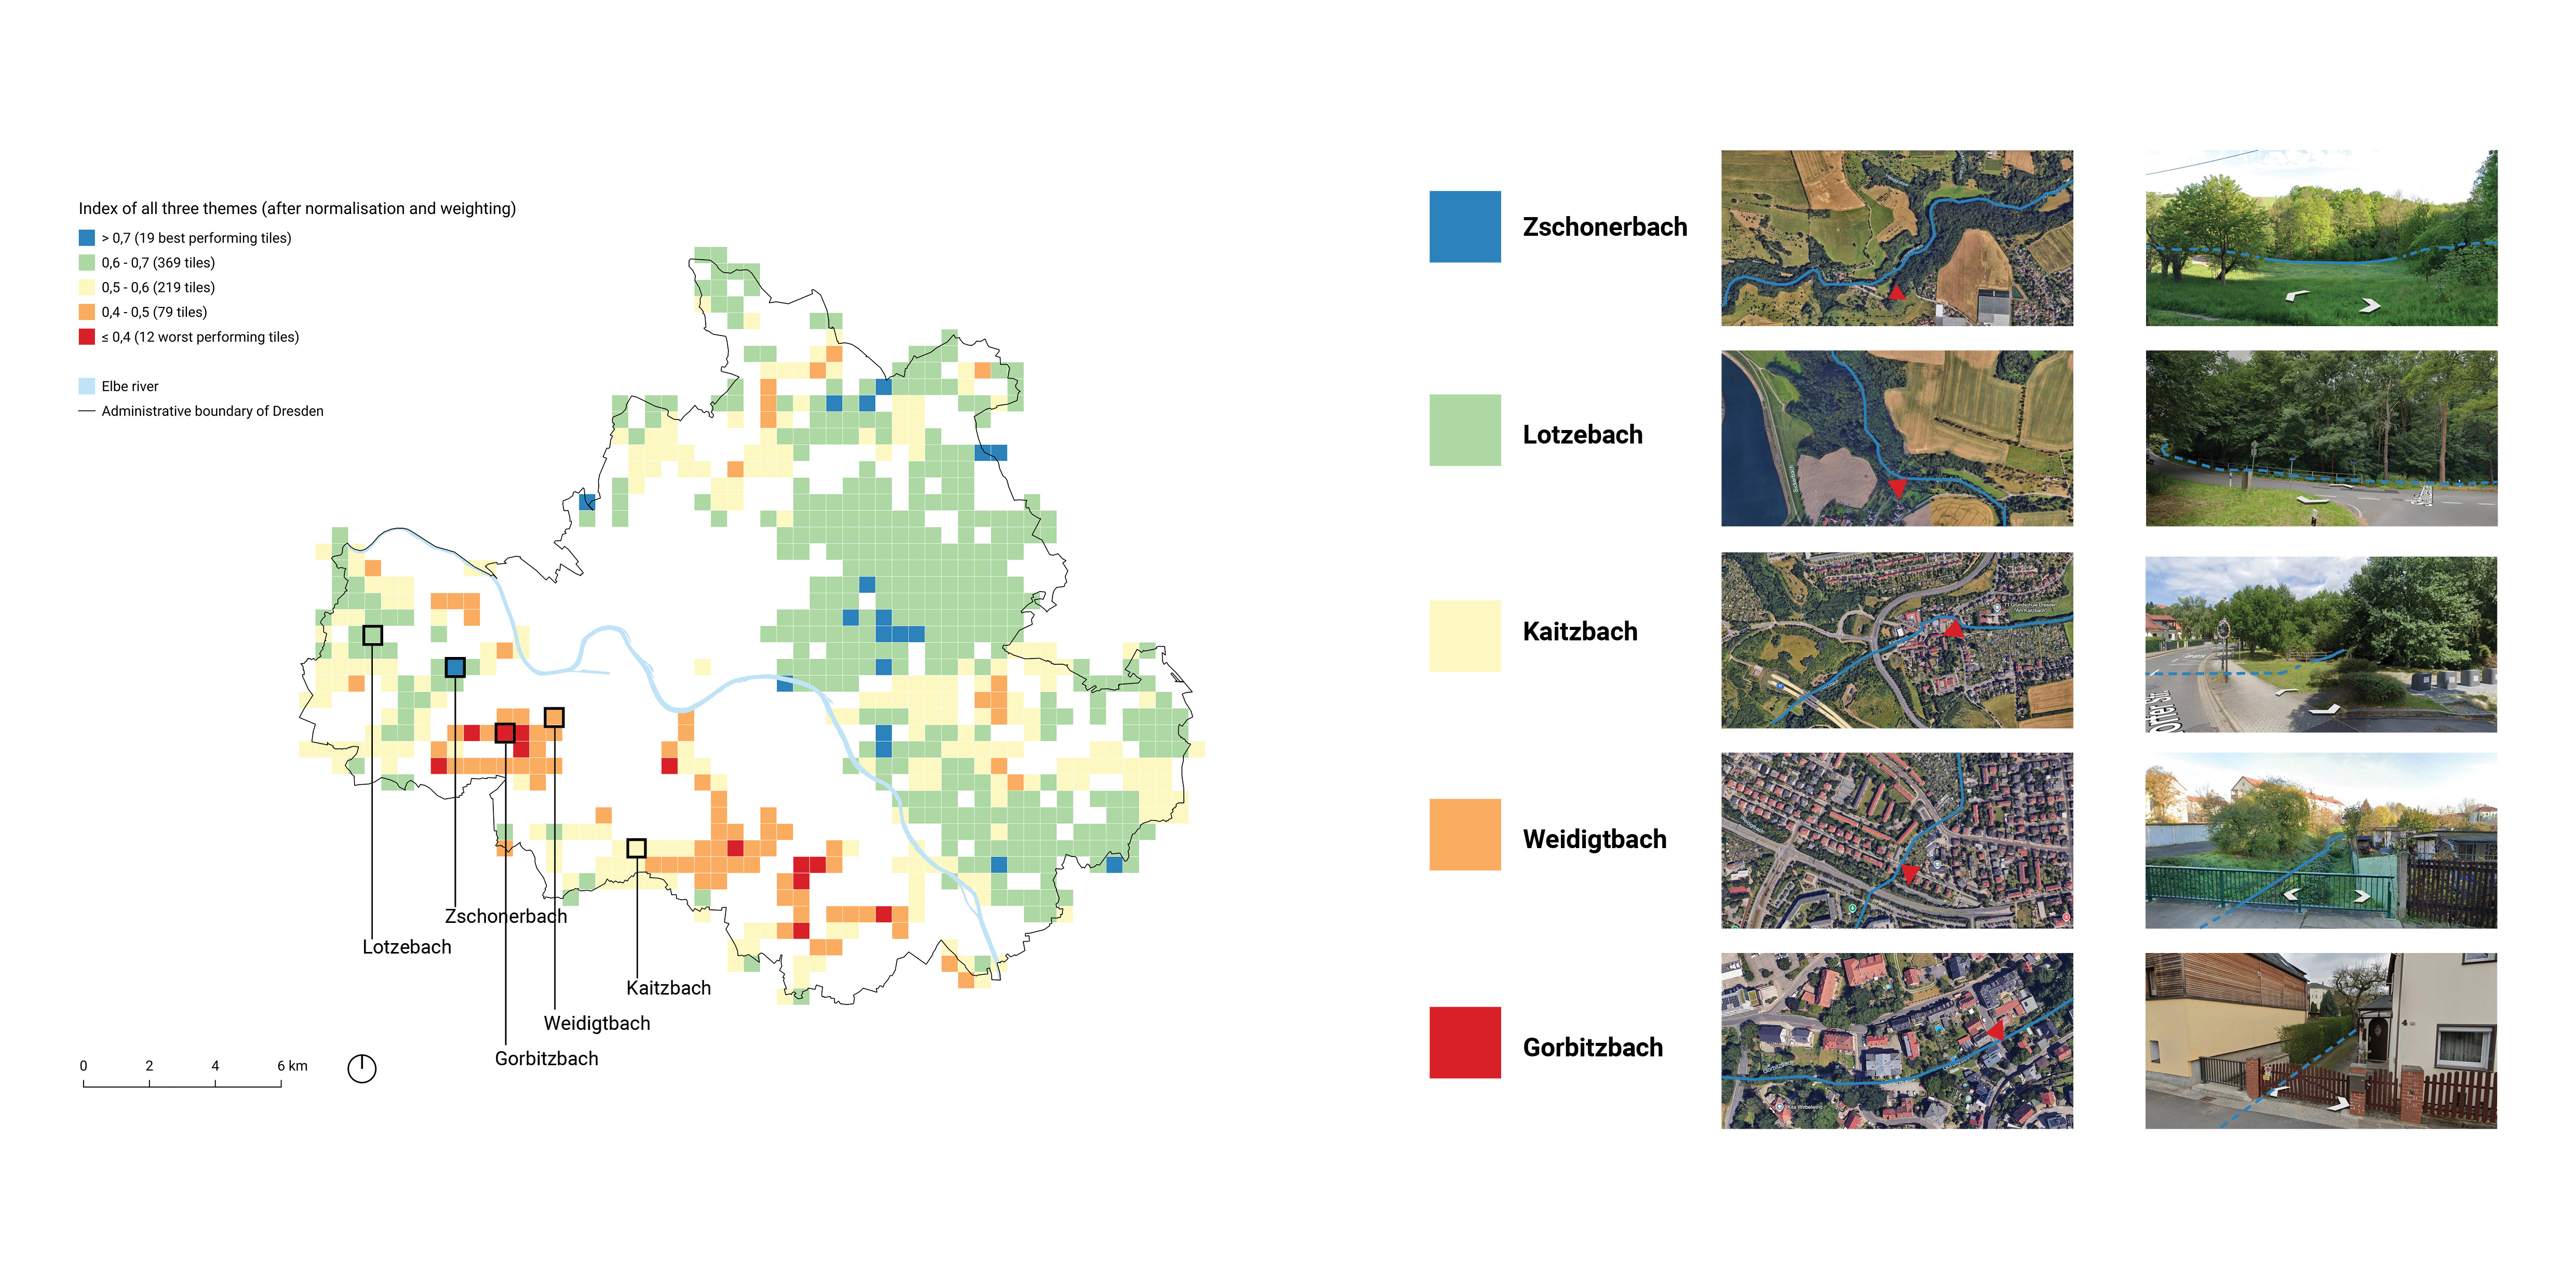
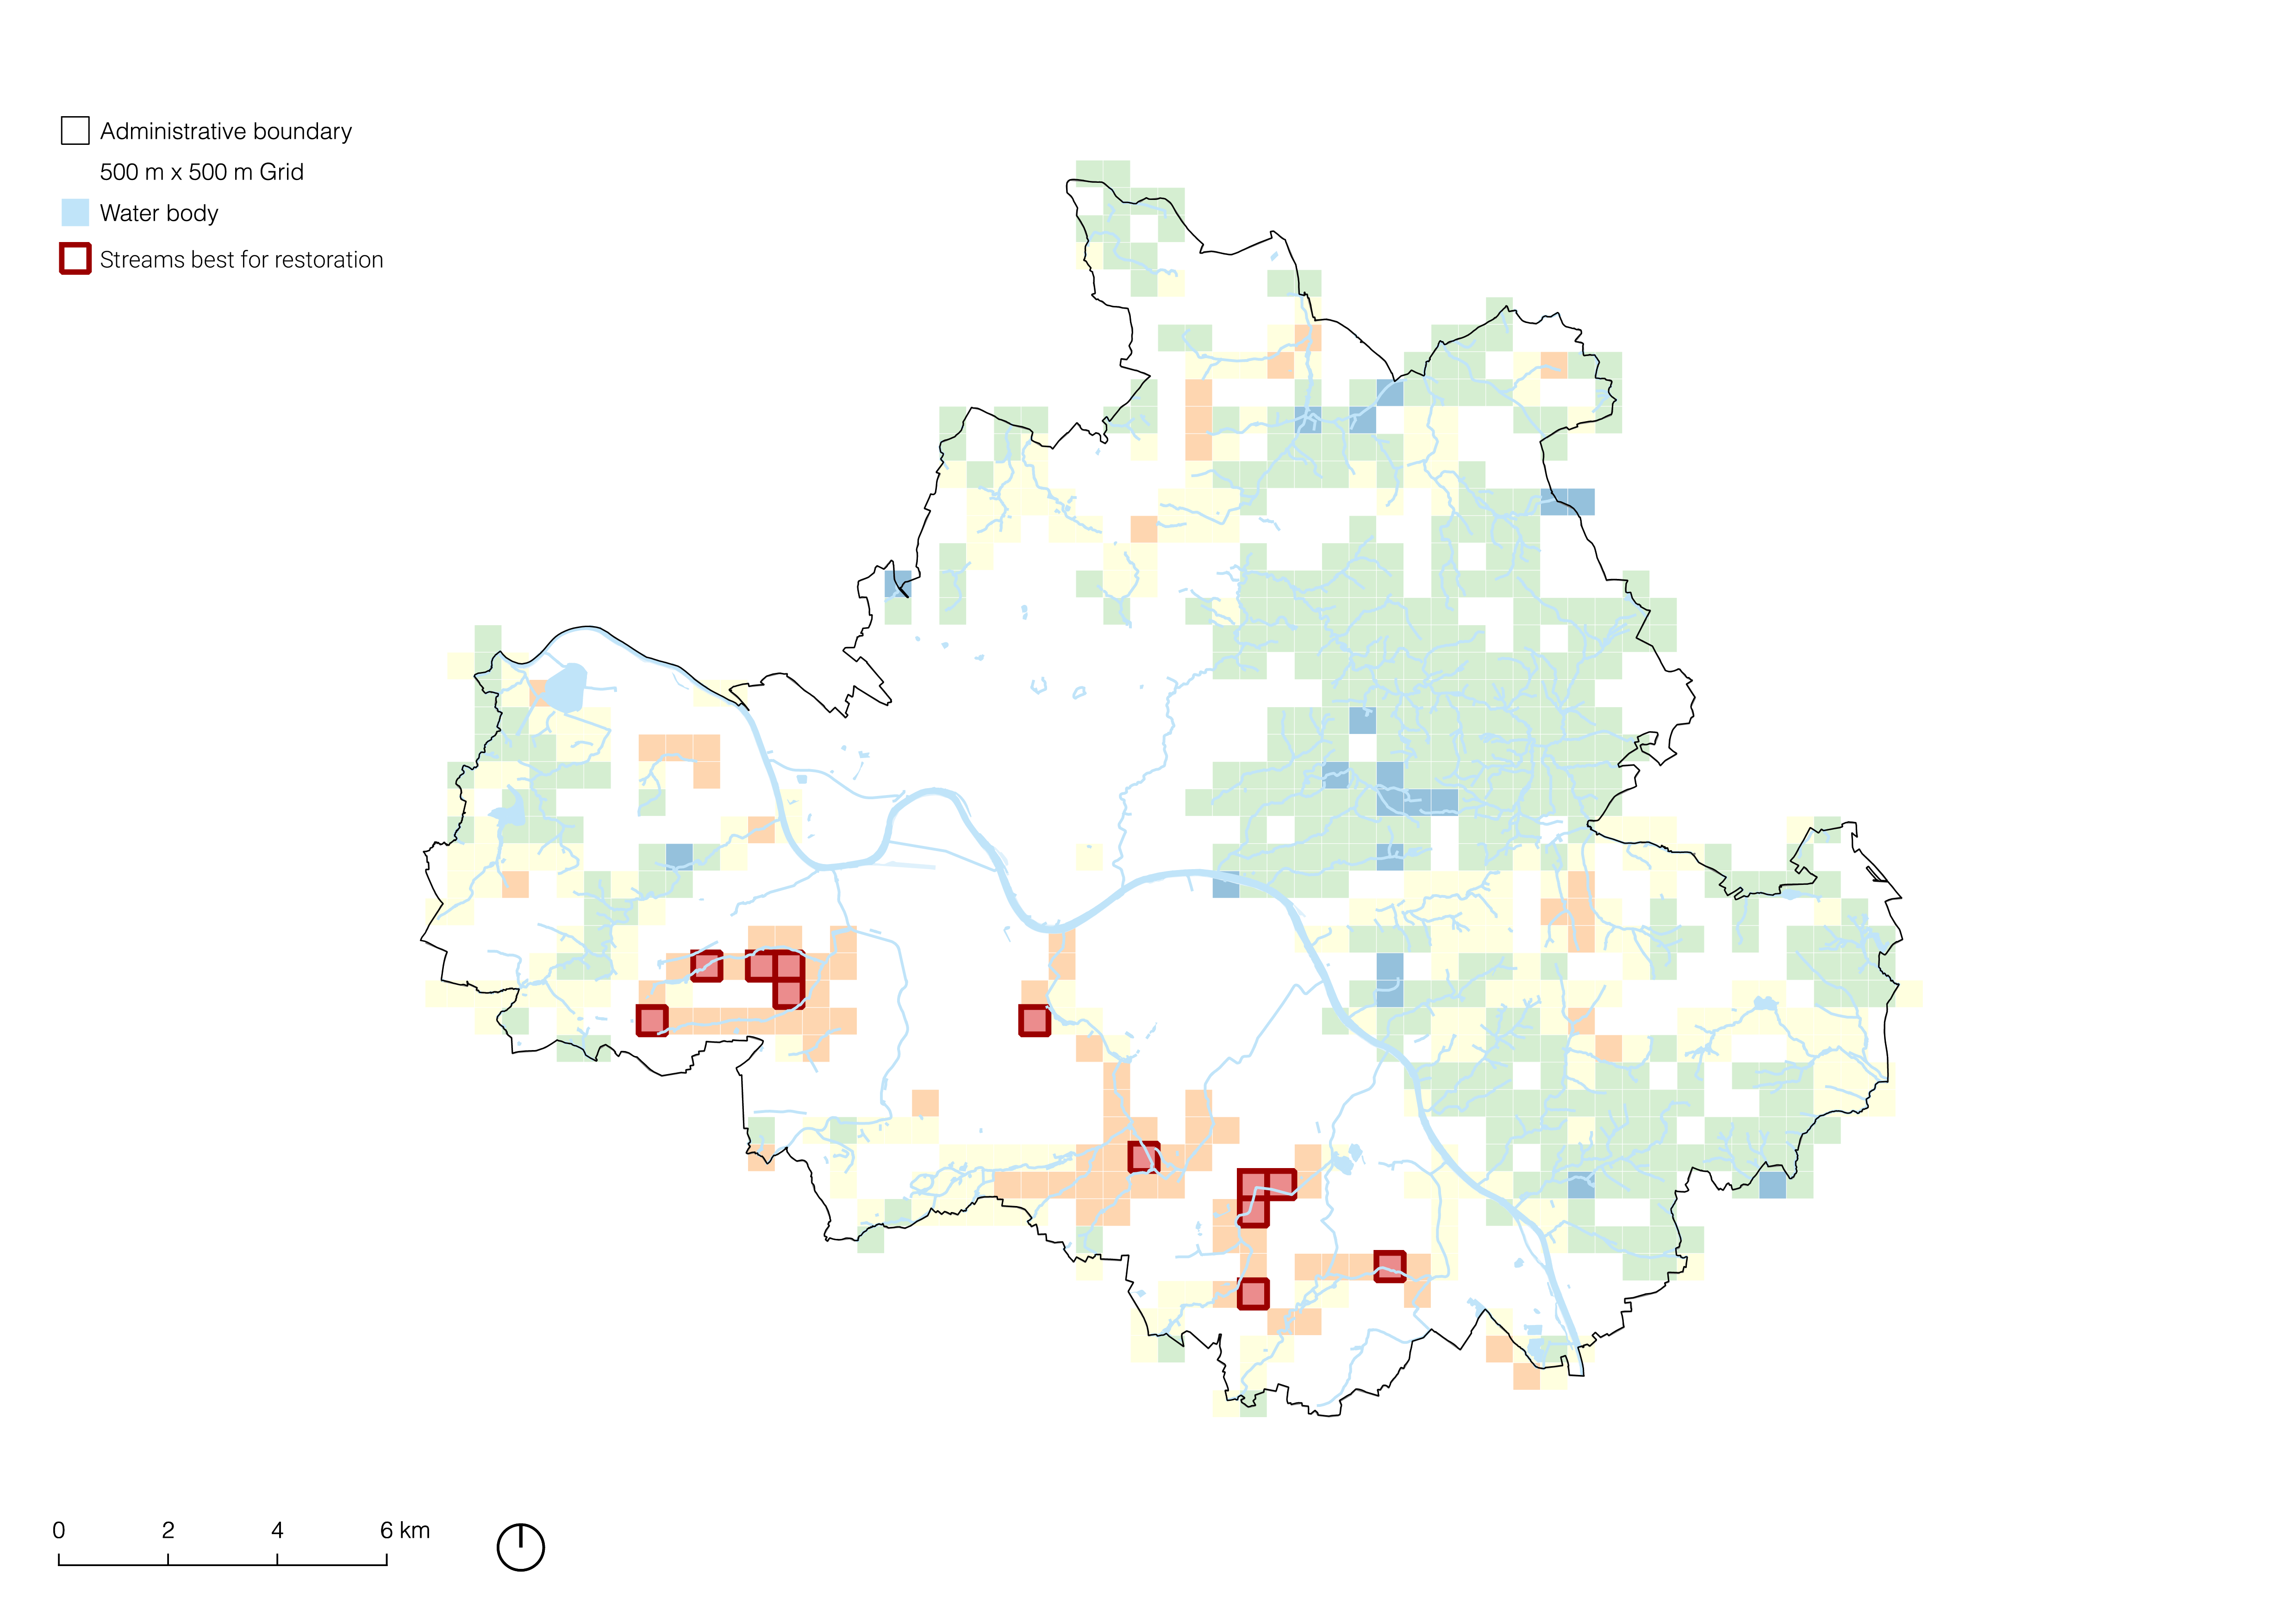
This map represents the overall weighted suitability index for urban stream restoration in Dresden, combining the three individual weighted themes, in which each is assigned equal importance within the typological framework.
This comprehensive map directly addresses the main research question of the project: “Which urban stream sections in Dresden have the greatest potential to contribute to the city’s integrated climate resilience?” It shows that the best-performing stream sections are predominantly located in the northern part of Dresden, an area largely characterised by natural ecosystems. In contrast, the worst-performing stream sections are mostly found in the built-up areas south of the Elbe River. These urbanised and residential zones represent sections with the greatest potential for improvement and contribution to the city’s climate resilience, making them priority targets for restoration.
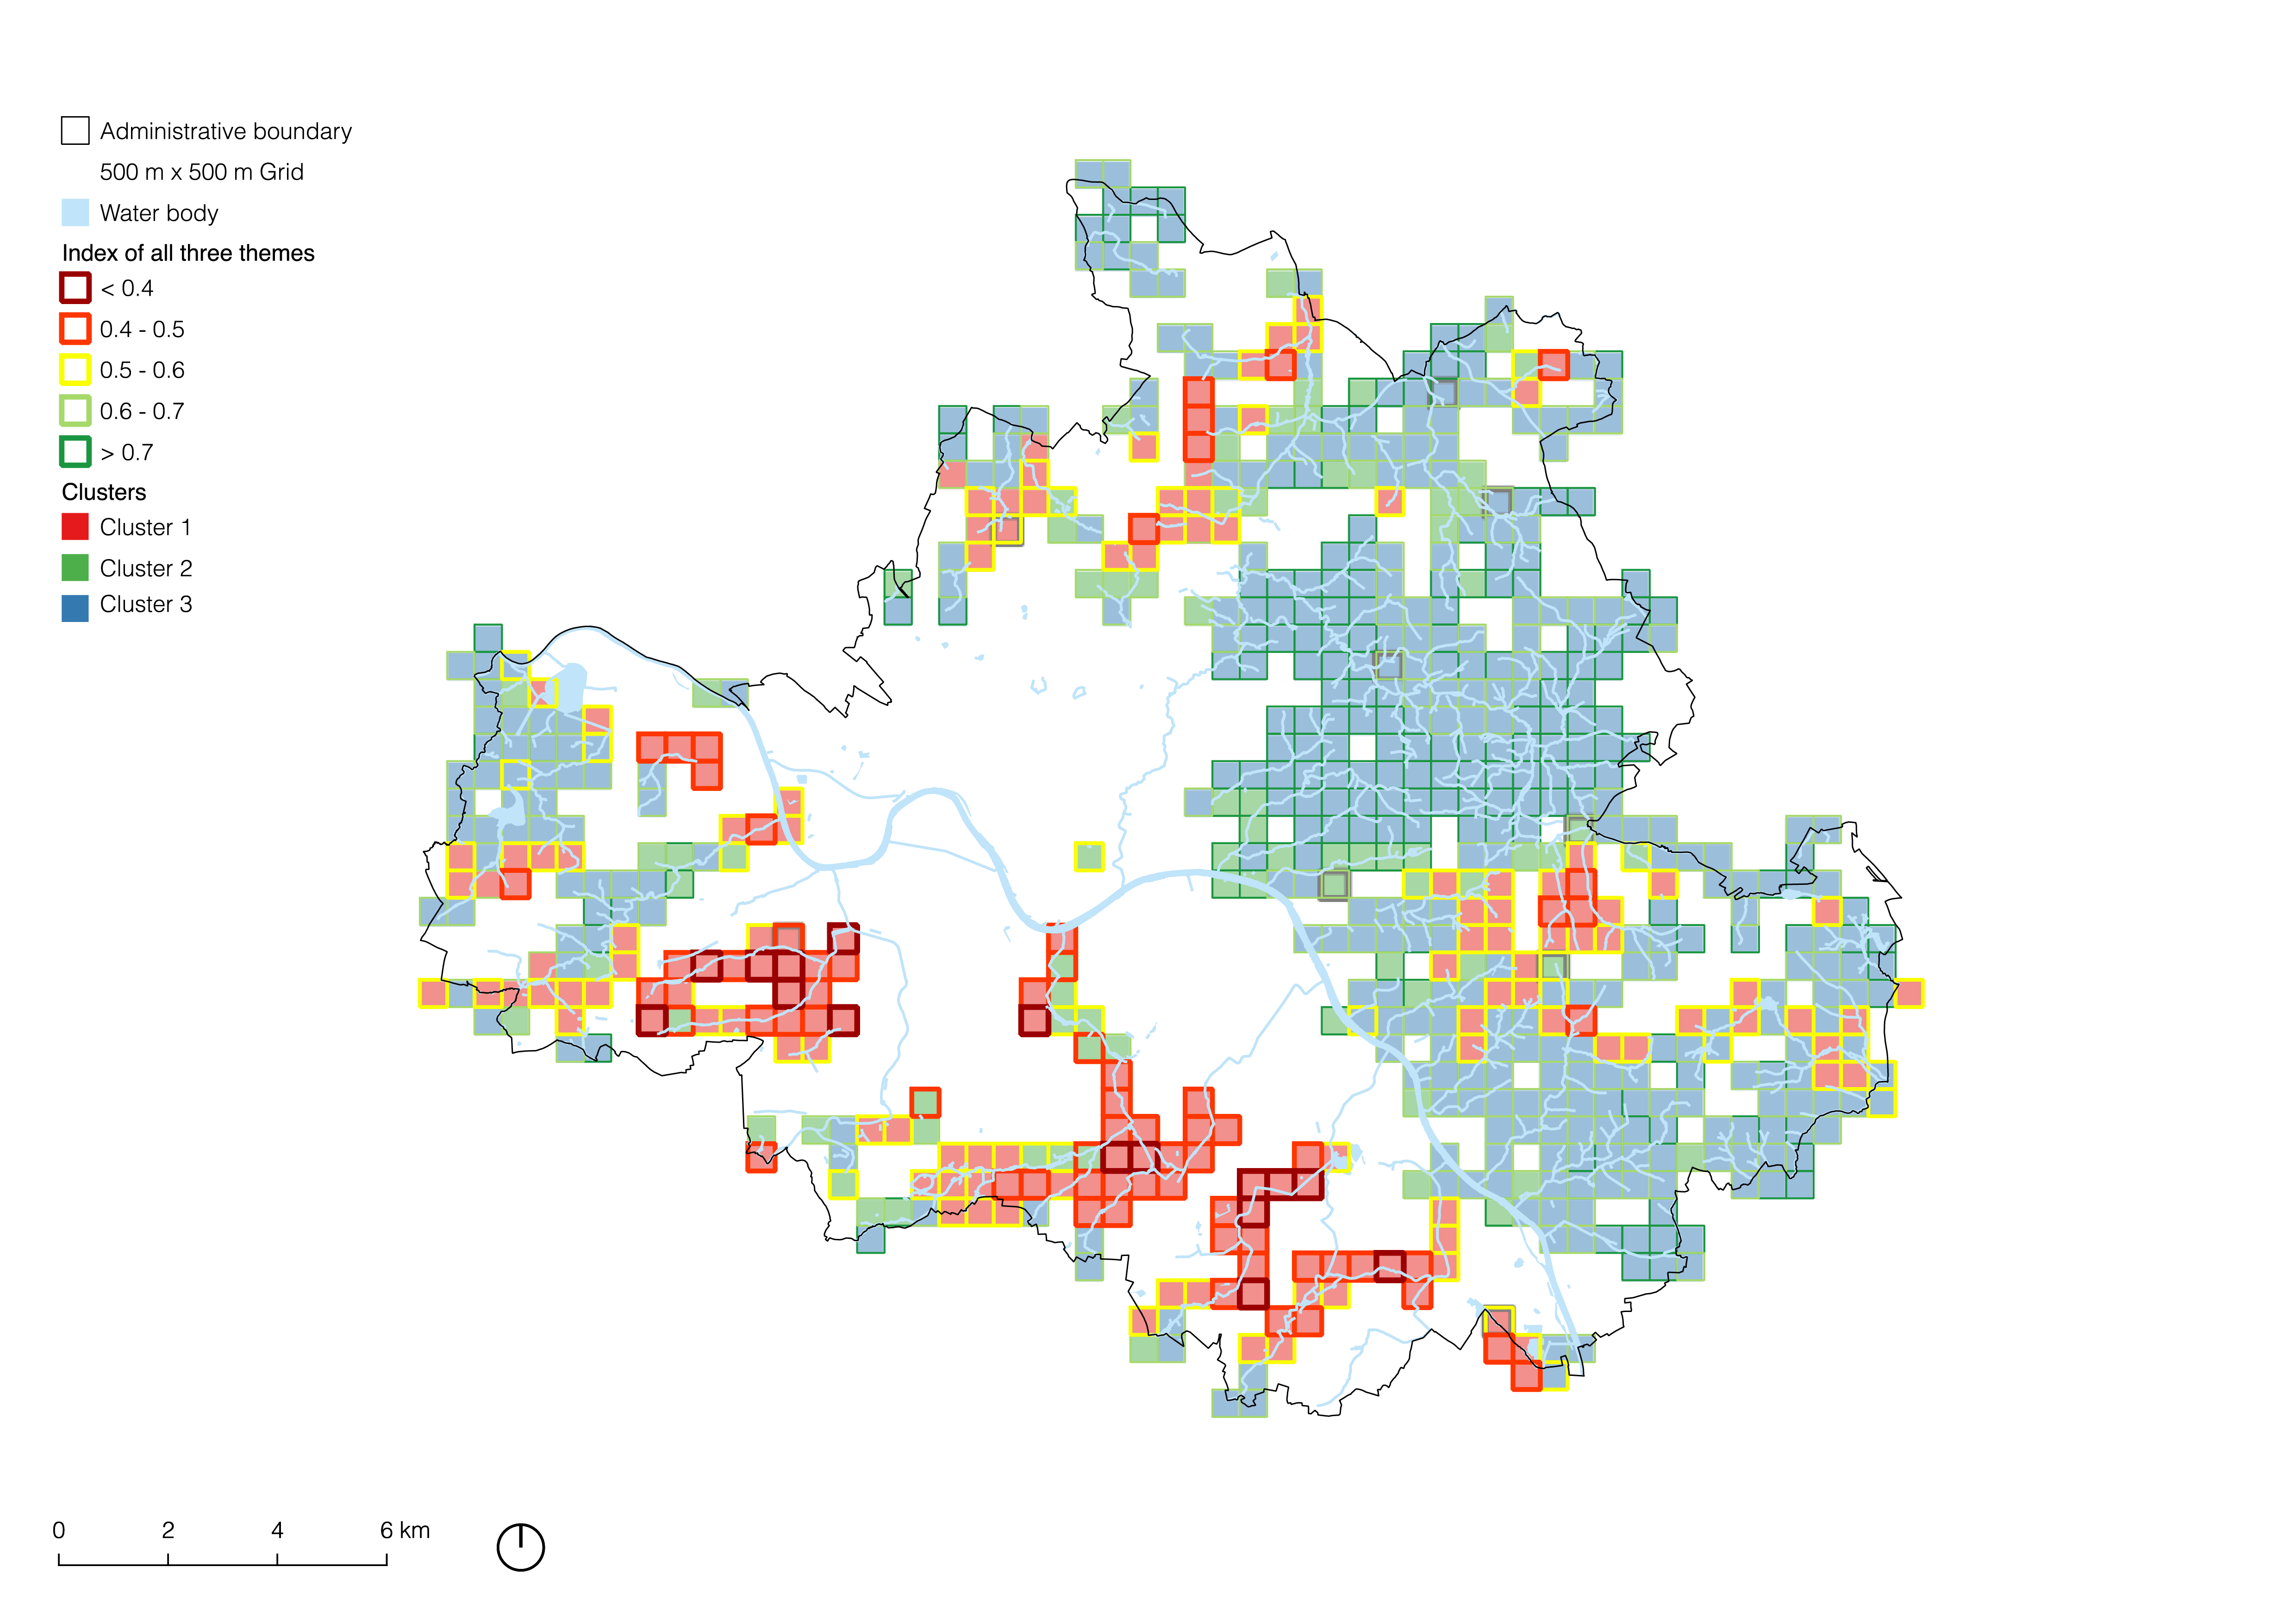
3.8 K-means clustering and topology definition


3.8.1 Typology Description
| Cluster | Biodiversity | Quality of Life | Climate Adaptation | Description |
|---|---|---|---|---|
| 1 | 0.619 | 0.424 | 0.460 | Urban, residential areas with low scores on biodiversity, quality of life and climate adaptation relative to other clusters |
| 2 | 0.790 | 0.441 | 0.674 | Forested areas with a great biodiversity, high levels of climate adaptation and an average quality of life |
| 3 | 0.726 | 0.540 | 0.558 | Transition zones between urban and nature with average levels of biodiversity, and climate adaptation and a high level on quality of life |
4 Recommendations
4.1 Recommendations based on MCDA
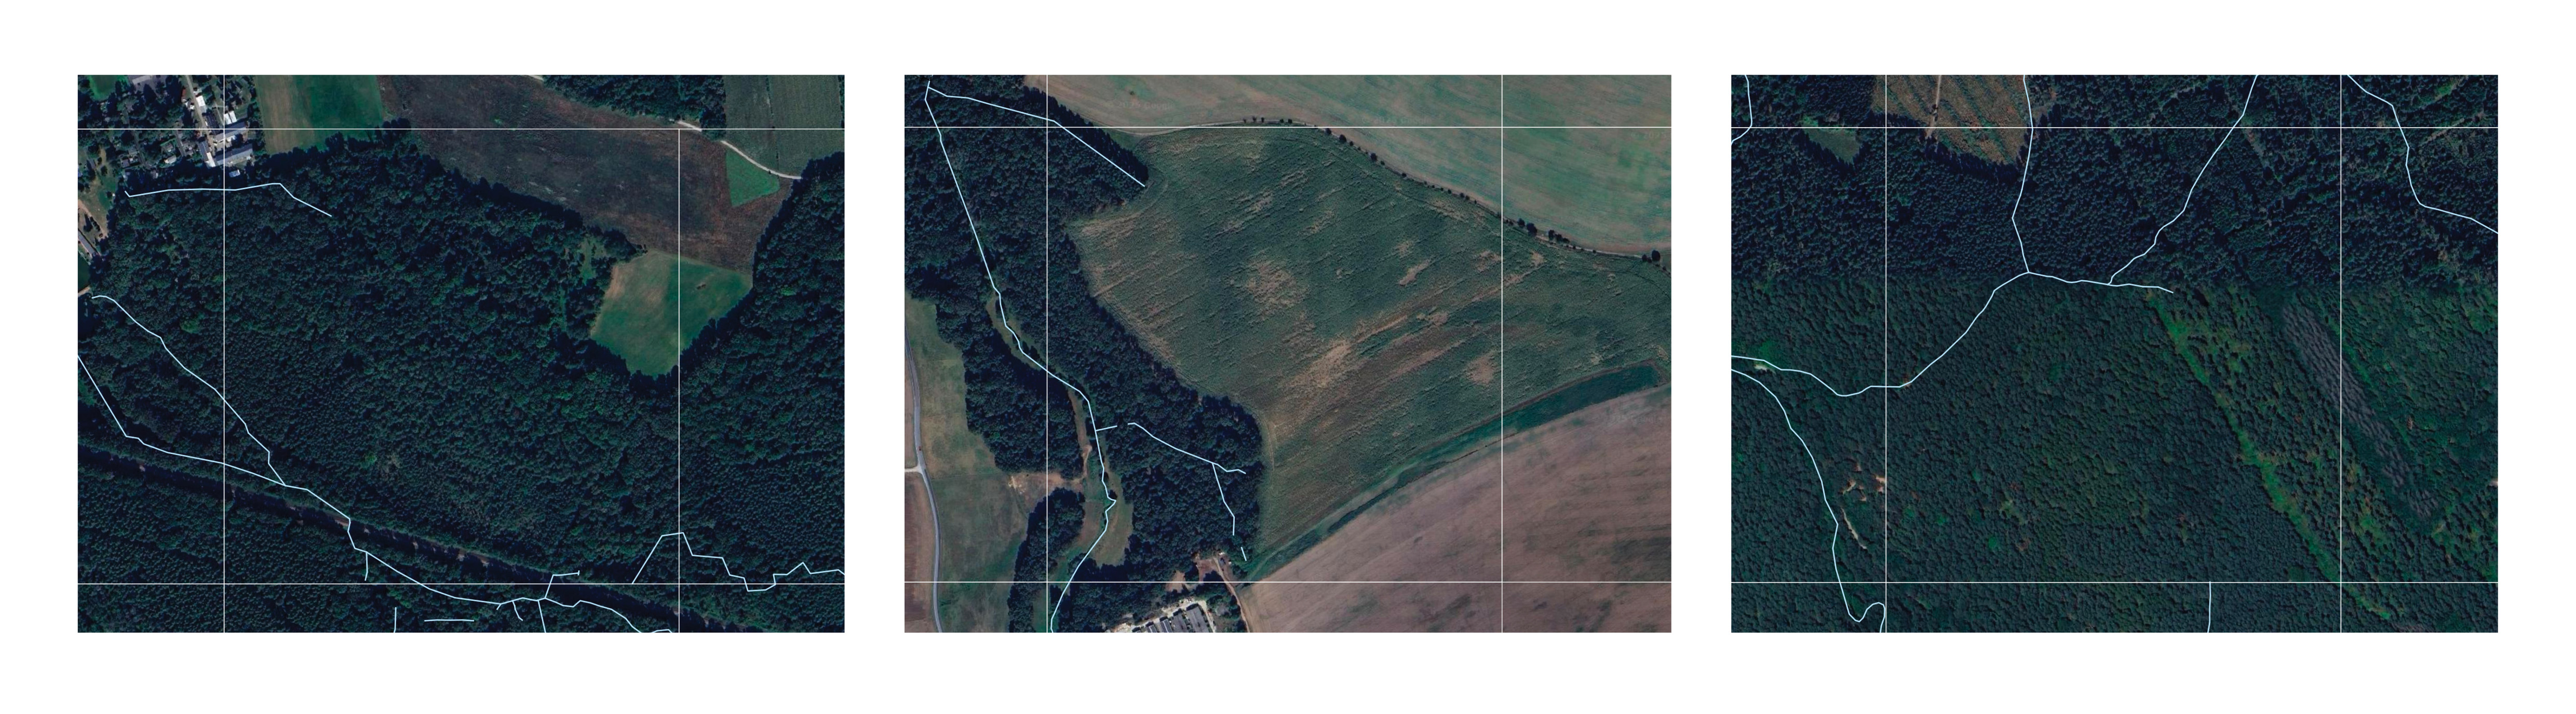
There are in total five types of areas, ranging from best to worst performing urban streams. It is evident that the best-performing tiles consist of unaltered or near-natural areas. The areas faring well, like Zschonerbach and Lotzebach, may require interventions only in some areas. In forest-adjacent areas, restoration should aim at enhancing hydrological connectivity, preserving riparian vegetation, and rewilding streambanks using soft engineering. Design must prioritise minimal intervention, enabling natural processes while integrating ecological trails for education.
The average-performing areas, such as Kaitzbach, comprise a mix of natural and urbanised areas. Here, the design interventions should integrate riparian green corridors, permeable surfaces, multifunctional public spaces to restore ecological continuity and manage runoff, and prioritise nature-based solutions and habitat connectivity across urban–natural edges.
The worst-performing areas, like Weidigtbach and Gorbitzbach, are the urbanised, residential areas where the urban streams have been almost completely altered. In highly urbanised areas, restoration should focus on daylighting buried streams, implementing green-blue infrastructure, and retrofitting impermeable zones with bioswales and rain gardens. These areas should also incorporate multifunctional public spaces that enhance ecological function and social value, supporting resilience in densely built environments.
4.2 Recommendations based on Typology Construction
For Cluster 1, which comprises highly urbanised and predominantly residential areas, incorporating channel re-meandering restores hydrological dynamics, reduces flow velocity, and enhances sediment retention, thereby contributing to flood mitigation and ecological recovery (What Is River Restoration?, n.d.). Blue-green infrastructure, including bioswales, rain gardens, and constructed wetlands, supports stormwater management, improves water quality, and integrates public realm functions (Ahern, 2011). Large canopy trees within 10 meters of streams offer critical microclimatic regulation, reduce urban heat island effects, and stabilise banks through root structures, while enhancing habitat and user comfort (Gill et al., 2007). Together, these measures align ecological performance with urban liveability.
For Cluster 2, which comprises forest areas and natural ecosystems, integrating water retention basins along streams helps modulate peak flows, enhancing flood resilience and groundwater recharge (EEA, 2017). Constructed wetlands combined with socio-ecological programs promote biodiversity, ecological education, and community engagement (Mitsch & Gosselink, 2015). Sediment management through strategic reforestation stabilises catchment slopes, reduces erosion, and improves downstream water quality (Havel et al., 2015). These nature-based solutions support holistic restoration by reconnecting hydrological processes with ecological functions while fostering inclusive, multifunctional landscapes that benefit both human and natural systems.
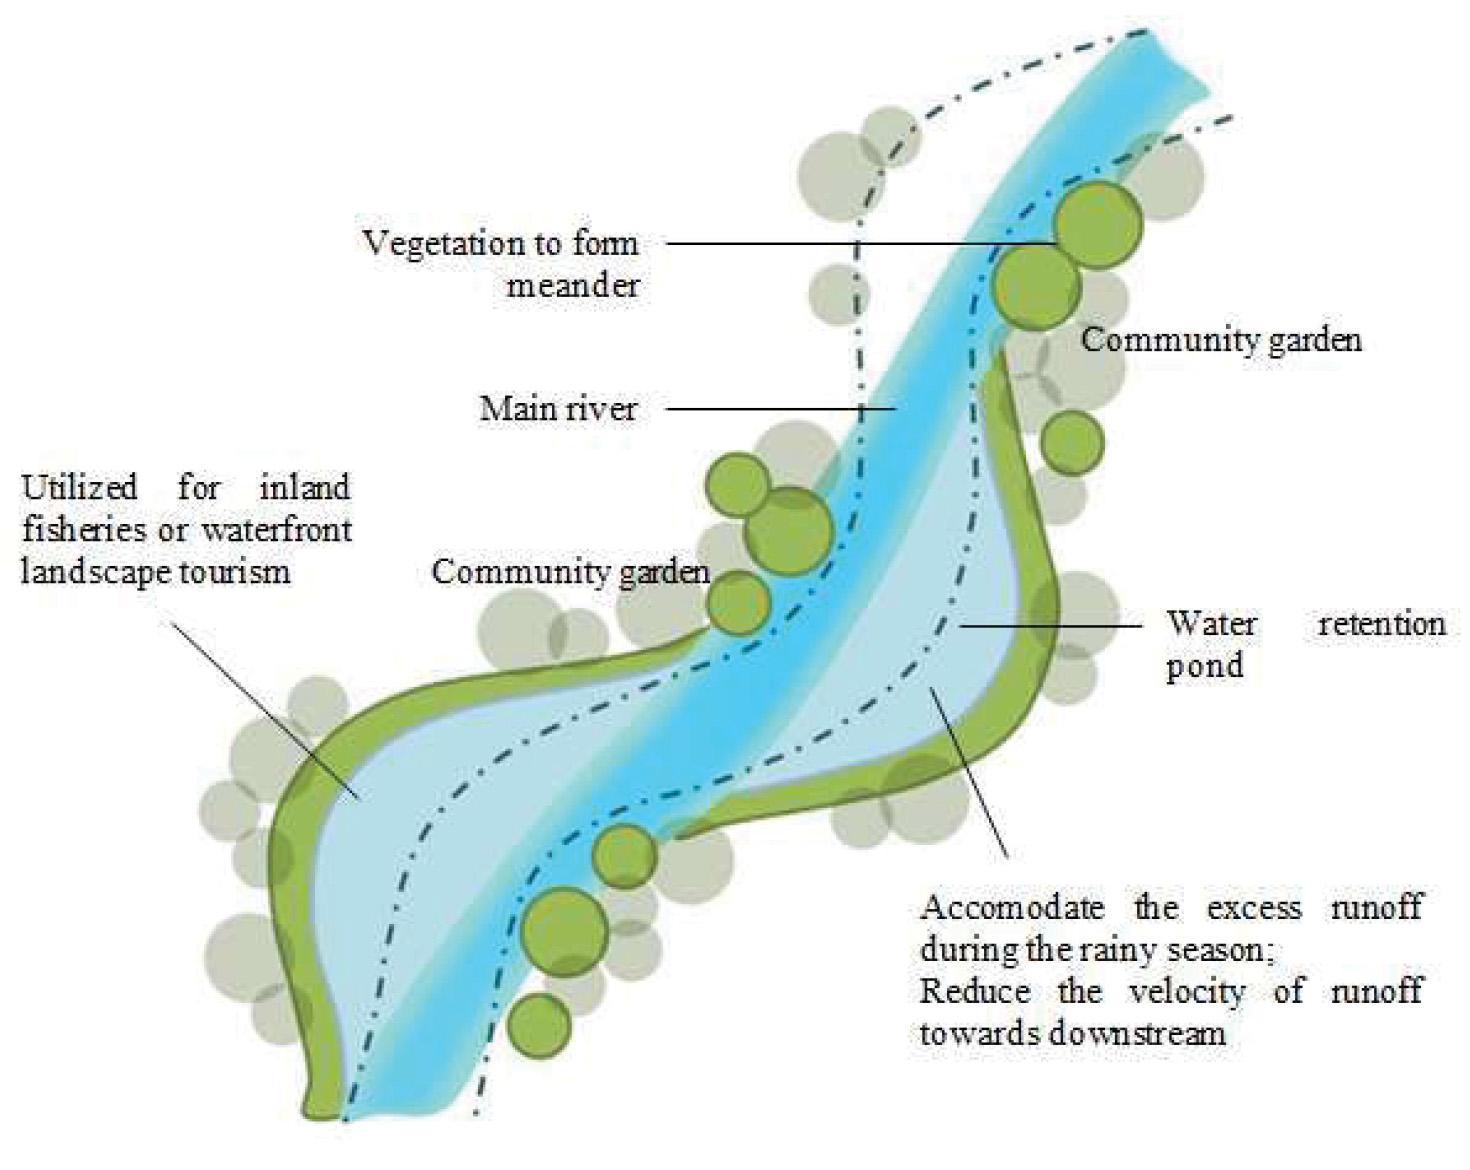
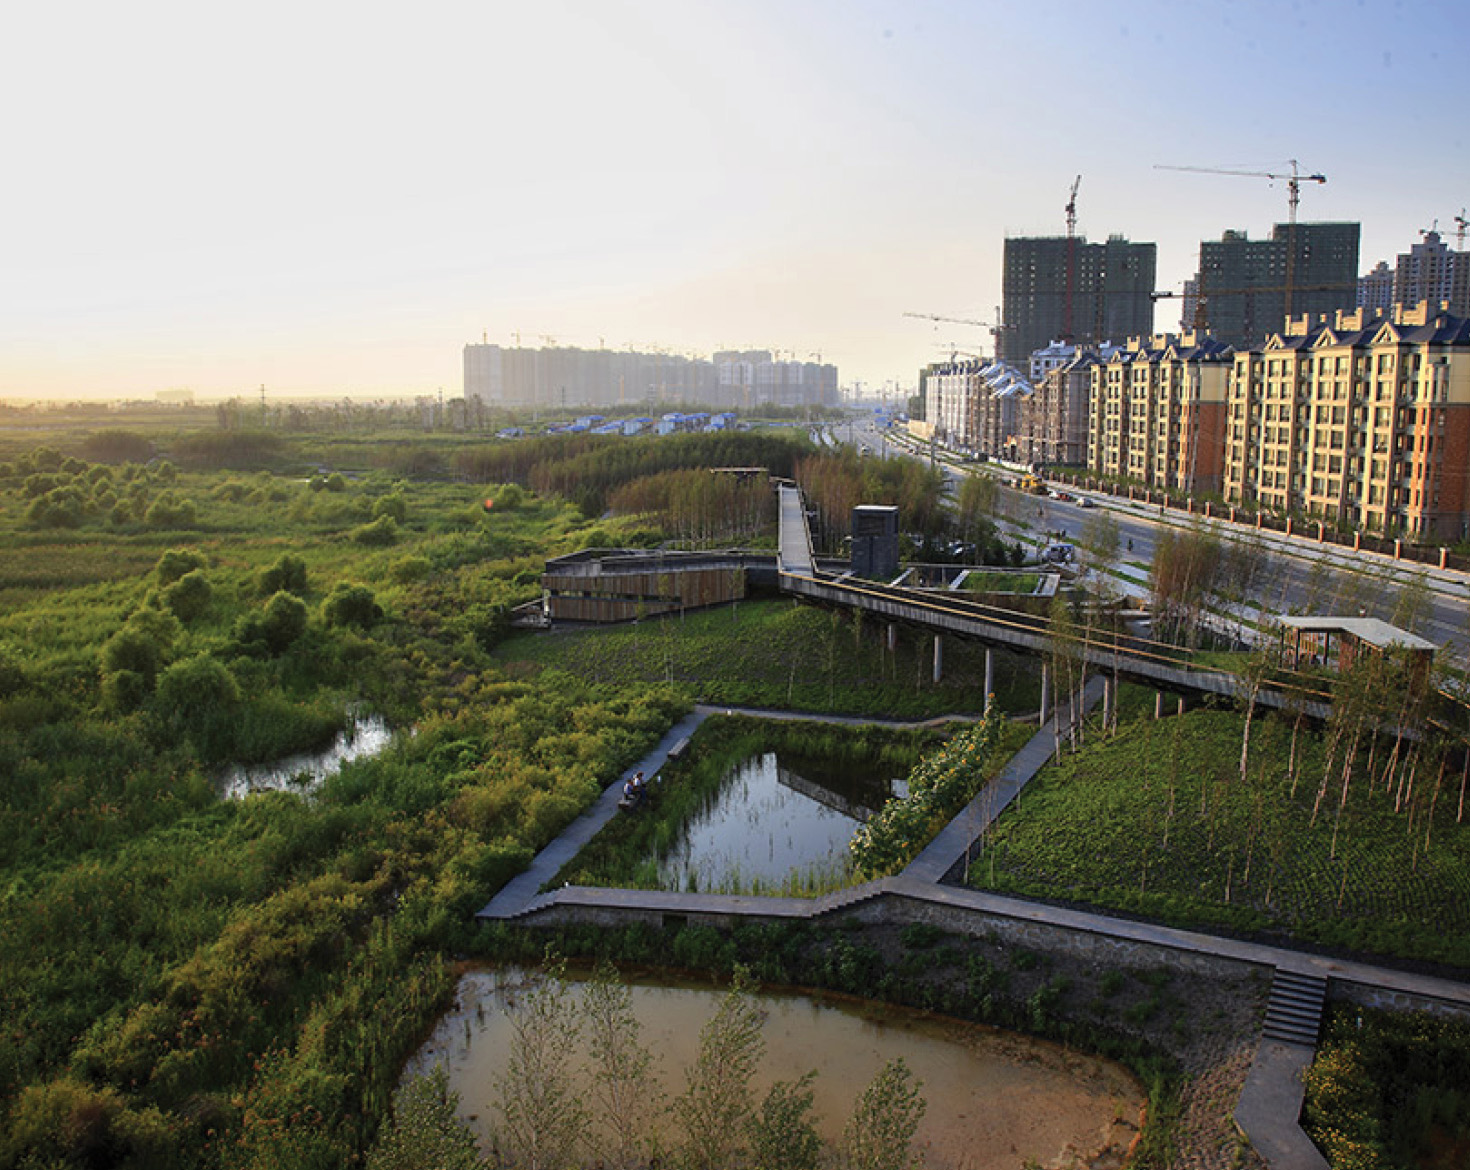
For Cluster 3, which comprises transition spaces between urban spaces and natural ecosystems, multifunctional urban stream restoration should be achieved. Designing these areas with parks and seating encourages public interaction, stewardship, and equitable access to blue-green spaces (Kabisch et al., 2016). Integrating natural culverts enables ecological connectivity and unimpeded water flow, reducing fragmentation. Enhancing the riparian zone through native planting stabilises banks, filters runoff, and supports biodiversity. These design interventions promote socio-ecological resilience by blending functionality, aesthetics, and sustainability across urban-natural interfaces.
5 Discussion
5.1 Site selection
Selecting grid cells based solely on whether they intersect with a stream does not consider the relevance of each separate cell. Some cells may minimally intersect the stream, such as a small corner, while others may contain longer, centrally located segments. This variation is not currently accounted for in the MCDA. Future research could incorporate an additional variable concerning the length of the stream within each grid cell, providing a better indication of the relative importance of each grid cell.
5.2 Grid cell size
Selecting grid cells based solely on whether they intersect with a stream does not consider the relevance of each separate cell. Some cells may minimally intersect the stream, such as a small corner, while others may contain longer, centrally located segments. This variation is not currently accounted for in the MCDA. Future research could incorporate an additional variable concerning the length of the stream within each grid cell, providing a better indication of the relative importance of each grid cell.
5.3 The variables used
Subjects such as quality of life, climate adaptation, and biodiversity are broad and can be assessed using many different variables. Having to select which variables to consider in the MCDA introduces the risk of motivational bias, in which the selection of variables is influenced by the desirable outcome (Montibeller & Von Winterfeldt, 2015). Additionally, the weighting of these variables was based on the authors’ preferences as well as the availability of data, which further introduces potential bias into the analysis.
The use of space syntax, especially within the Attraction Reach module, has its limitations that may lead to inconsistencies in the analysis. Since all addresses were used as origins, areas without addresses, such as the Dresdner Heide, will be outliers within this analysis. This results in skewed data and may account for the moderate scores in the weighted quality of life map.
5.4 Proposals based on the analysis
Utilising Multi-Criteria Decision Analysis (MCDA), fifteen attributes were normalised and assigned weighted values to form three overarching objectives: biodiversity, climate adaptation, and quality of life, each given equal significance in the typological framework. While establishing a shared baseline for all urban streams enables consistent comparative analysis, it is critical to account for the specific weight distribution of the fifteen attributes when addressing underperforming cases. For the twelve lowest-ranked streams, differentiated design strategies must reflect the relative influence of each attribute, allowing context-sensitive interventions that align with site-specific ecological and social needs.
6 Further research
In this project, all the urban streams within the Dresden boundary were considered. Considering the scale of the analysis, it was difficult to account for more zoomed-in understandings, such as the width of the stream and the riparian zone around, which are important while analysing and recommending context-specific solutions. For the twelve cases, a detailed analysis with a grid of 100-by-100 metres can be further considered to include stream widths, riparian zone width, vegetation cover, surface permeability, and proximity to water bodies, which are essential for stream restoration. However, such fine resolution may lead to data redundancy and increase complexity in citywide applications. A 50–100 m grid balances detail and feasibility for assessing ecosystem service distribution and hydrological patterns across urban subcatchments (Roest et al., 2023).
Additionally, other variables (if publicly available), other methodologies and ‘translations’ into the calculated normalised values may be considered with other, perhaps more specific (political, urban, etc.) goals in mind.
6.1 Workflow reproducibility
In addition, future work could focus specifically on the project’s adherence to FAIR principles and improving our analysis reproducibility from A-Z. Regarding workflow reproducibility, an important improvement could be in addressing and reducing/ removing the current reliance on QGIS for spatial analysis, since this is inherently a way of working which consists of unscripted operations and without version control. Potentially, the QGIS operations could be scripted either using PyQGIS or plain programming languages like Python or R. However, if full scripting is not feasible, numbered instructions with screenshots and explanations about parameter values used would already significantly improve reproducibility, a sort of ‘Reproduction Guide’.
7 Conclusion
By conducting MCDA and comparing it to the k-means clustering to mitigate flood risks, improving quality of life and enhancing biodiversity, the main research question can be answered: Which urban stream sections in Dresden have the greatest potential to contribute to the city’s integrated climate resilience?
As result of the S-MCDA analysis, the following map displays the grid cells, specifically the twelve grid cells/stream sections that are currently performing the worst overall, and thus have the greatest potential for improvement and contribution to the city’s integrated climate resilience. The map highlights that the best performing stream sections are predominantly in the Northern part of Dresden, which is largely covered by natural ecosystems. Whereas the worse performing stream are mainly found in the built up environments South of the Elbe River.
While the MCDA and Typology Construction are two different methodologies, there is also merit in overlaying them and objectively cross-checking data. The conclusion map shown below visualises the MCDA overlayed with the K-means clustering typologies. It ascertains the intuitive understanding and provides evidence that the urban, residential clusters overlap with the worst-performing streams. Furthermore, it is evident that the worst-performing tiles derived from MCDA are significantly further in values as compared to the ones nearest to the cluster centres. This advocates the need for considering the MCDA results as pilot cases and utilising the typology construction methodology to propose a toolkit for urban stream restoration efforts in varying contexts.
8 Bibliography
Adamska, M. (2013). Riparian buffer zones on selected rivers in Lower Silesia – an important conservation practice and the management strategy in urban planning. Contemporary Trends in Geoscience, 2(1), 6–17. https://doi.org/10.2478/ctg-2014-0001
Akpinar, A. (2016). How is quality of urban green spaces associated with physical activity and health? Urban Forestry & Urban Greening, 16, 76-83. https://doi.org/10.1016/j.ufug.2016.01.011
Arnbjerg-Nielsen, K., Willems, P., Olsson, J., Beecham, S., Pathirana, A., Gregersen, I. B., Madsen, H., & Nguyen, V. (2013). Impacts of climate change on rainfall extremes and urban drainage systems: a review. Water Science & Technology, 68(1), 16–28. https://doi.org/10.2166/wst.2013.251
Artmann, M., Bastian, O., & Grunewald, K. (2017). Using the concepts of green infrastructure and ecosystem services to specify leitbilder for compact and green Cities—The example of the Landscape Plan of Dresden (Germany). Sustainability, 9(2), 198. https://doi.org/10.3390/su9020198
Bao, Y., Gao, M., Luo, D., & Zhou, X. (2022). The influence of outdoor play spaces in urban parks on children’s social anxiety. Frontiers in Public Health, 10. https://doi.org/10.3389/fpubh.2022.1046399
Bohus, A., Gál, B., Barta, B., Szivák, I., Karádi-Kovács, K., Boda, P., Padisák, J., & Schmera, D. (2023). Effects of urbanization-induced local alterations on the diversity and assemblage structure of macroinvertebrates in low-order streams. Hydrobiologia, 850(4), 881–899. https://doi.org/10.1007/s10750-022-05130-1
Booth, D. B., Hartley, D., & Jackson, R. (2002). FOREST COVER, IMPERVIOUS‐SURFACE AREA, AND THE MITIGATION OF STORMWATER IMPACTS1. JAWRA Journal of the American Water Resources Association, 38(3), 835–845. https://doi.org/10.1111/j.1752-1688.2002.tb01000.x
Bowler, D. E., Buyung-Ali, L., Knight, T. M., & Pullin, A. S. (2010). Urban greening to cool towns and cities: A systematic review of the empirical evidence. Landscape and Urban Planning, 97(3), 147–155. https://doi.org/10.1016/j.landurbplan.2010.05.006
Cohen, D. A., Han, B., Williamson, S., Nagel, C., McKenzie, T. L., Evenson, K. R., & Harnik, P. (2019). Playground features and physical activity in U.S. neighborhood parks. Preventive Medicine, 131, 105945. https://doi.org/10.1016/j.ypmed.2019.105945
Convertino, M., Baker, K., Vogel, J., Lu, C., Suedel, B., & Linkov, I. (2012). Multi-criteria decision analysis to select metrics for design and monitoring of sustainable ecosystem restorations. Ecological Indicators, 26, 76–86. https://doi.org/10.1016/j.ecolind.2012.10.005
Corsair, H. J., Ruch, J. B., Zheng, P. Q., Hobbs, B. F., & Koonce, J. F. (2009). Multicriteria decision analysis of stream restoration: potential and examples. Group Decision and Negotiation, 18(4), 387–417. https://doi.org/10.1007/s10726-008-9148-4
Dadvand, P. & Nieuwenhuijsen, M. (2018). Green Space and Health. In Nieuwenhuijsen, M. & Khreis, H. (Eds.), Integrating Human Health into Urban and Transport Planning. (pp. 409 – 423). Springer, Cham. https://doi-org.tudelft.idm.oclc.org/10.1007/978-3-319-74983-9_20
Deutsch, K., Leroy, D., Belpaire, C., Haan, K. D., Vrana, B., Clayton, H., Hanke, G., Ricci, M., Held, A., Gawlik, B., Babut, M., Perceval, O., Lepom, P., Heiss, C., Koschorreck, J., O’Toole, S., Valsecchi, S., Polesello, S., Carere, M., . . . Viñas, L. (2014). Common implementation strategy for the Water Framework Directive (2000/60/EC). Guidance Document No. 32 ON BIOTA MONITORING (THE IMPLEMENTATION OF EQSBIOTA) UNDER THE WATER FRAMEWORK DIRECTIVE. CTIT Technical Reports Series. https://doi.org/10.2779/833200
De Vries, W., Schulte-Uebbing, L., Kros, H., Voogd, J. C., & Louwagie, G. (2021). Spatially explicit boundaries for agricultural nitrogen inputs in the European Union to meet air and water quality targets. The Science of the Total Environment, 786, 147283. https://doi.org/10.1016/j.scitotenv.2021.147283
Dietz, M. E. (2007). Low Impact Development Practices: A review of current research and recommendations for future directions. Water Air & Soil Pollution, 186(1–4), 351–363. https://doi.org/10.1007/s11270-007-9484-z
Dresden. (2024, December 12). Projektbeschreibung und Ziele | Blaues Band Geberbach | Landeshauptstadt Dresden. https://www.dresden.de/de/stadtraum/umwelt/umwelt/oberflaechenwasser/blaues-band/Projektbeschreibung.php
European Environment Agency (EEA). (2017). Green infrastructure and flood management – Promoting nature-based solutions. EEA Report No 14/2017. https://www.eea.europa.eu/publications/green-infrastructure-and-flood-management
Fletcher, T. D., Shuster, W., Hunt, W. F., Ashley, R., Butler, D., Arthur, S., Trowsdale, S., Barraud, S., Semadeni-Davies, A., Bertrand-Krajewski, J., Mikkelsen, P. S., Rivard, G., Uhl, M., Dagenais, D., & Viklander, M. (2014). SUDS, LID, BMPs, WSUD and more – The evolution and application of terminology surrounding urban drainage. Urban Water Journal, 12(7), 525–542. https://doi.org/10.1080/1573062x.2014.916314
Gascon, M., Triguero-Mas, M., Martínez, D., Dadvand, P., Forns, J., Plasència, A. & Nieuwenhuijsen, M.J. (2015). Mental Health Benefits of Long-Term Exposure to Residential Green and Blue Spaces: A Systematic Review. International Journal of Environmental Research and Public Health 12(4), 4354-4379. https://doi.org/10.3390/ijerph120404354
Giles-Corti, B., Broomhall, M.H., Knuiman, M., Collins, C., Douglas, K., Ng, K., Lange, A. & Donovan, R.J. (2005). Increasing walking: How important is distance to, attractiveness, and size of public open space? American Journal of Preventitive Medicine 2(2), 169-176. https://doi.org/10.1016/j.amepre.2004.10.018
Gill, S., Handley, J., Ennos, A., & Pauleit, S. (2007). Adapting Cities for climate Change: The role of the green infrastructure. Built Environment, 33(1), 115–133. https://doi.org/10.2148/benv.33.1.115
Grunewald, K., Richter, B., & Behnisch, M. (2019). Multi-Indicator Approach for Characterising Urban Green Space Provision at City and City-District Level in Germany. International journal of environmental research and public health, 16(13), 2300. https://doi.org/10.3390/ijerph16132300
Gu, J., Lee, J., Lee, S., Park, Y., & Park, S. (2025). Enhancing stream ecosystems through riparian vegetation management. Land, 14(6), 1248. https://doi.org/10.3390/land14061248
Han, S., Ye, Y., Song, Y., Yan, S., Shi, F., Zhang, Y., Liu, X., Du, H. & Song, D. (2022). A Systematic Review of Objective Factors Influencing Behavior in Public Open Spaces. Frontiers in Public Health, 10. https://doi.org/10.3389/fpubh.2022.898136
Hartig, T., Mitchell, R., De Vries, S. & Frumkin, H. (2014). Nature and Health. Annual Review of Public Health 35, 207-228. https://doi-org.tudelft.idm.oclc.org/10.1146/annurev-publhealth-032013-182443
Havel, J. E., Kovalenko, K. E., Thomaz, S. M., Amalfitano, S., & Kats, L. B. (2015). Aquatic invasive species: challenges for the future. Hydrobiologia, 750(1), 147–170. [https://doi.org/10.1007/s10750-014-2166-0}(https://doi.org/10.1007/s10750-014-2166-0)
Interreg Central Europe. (2025, May 8). Restoring urban streams to improve the microclimate in cities - Interreg Central Europe. https://www.interreg-central.eu/projects/rebioclim/
Kabisch, N., Qureshi, S., & Haase, D. (2014). Human–environment interactions in urban green spaces — A systematic review of contemporary issues and prospects for future research. Environmental Impact Assessment Review, 50, 25–34. https://doi.org/10.1016/j.eiar.2014.08.007
Kazmierczak, A., Bittner, S., Breil, M., Coninx, I., Johnson, K., Kleinenkuhnen, L., Kochova, T., Lauwaet, D., Nielsen, H. O., Smith, H., & Zandersen, M. (2020). Urban adaptation in Europe: how cities and towns respond to climate change. In European Environment Agency (EEA Report 12/2020). https://doi.org/10.2800/324620
KNMI - Central European flooding 2013. (n.d.). https://www.knmi.nl/kennis-en-datacentrum/achtergrond/central-european-flooding-2013
Liu, Y., & Zhang, Z. (2024). Effects of atmospheric particulate matter on microbial communities in Wetland ecosystems. Water, 17(1), 66. https://doi.org/10.3390/w17010066
Mant, J., Thorne, C., Burch, J., & Naura, M. (2020). Restoration of urban streams to create blue–green infrastructure. In Blue-Green Cities (pp. 77–97). https://doi.org/10.1680/bgc.64195.077
Marando, F., Salvatori, E., Fusaro, L., & Manes, F. (2016). Removal of PM10 by forests as a Nature-Based Solution for Air quality improvement in the metropolitan city of Rome. Forests, 7(7), 150. https://doi.org/10.3390/f7070150
Mitsch, W. J., & Gosselink, J. G. (2015). Wetlands. John Wiley & Sons. https://www.researchgate.net/publication/271643179_Wetlands_5th_edition
Montibeller, G. & Von Winterfeldt, D. (2015). Biases and Debiasing in Multi-Criteria Decision Analysis. Paper presented at the 2015 48th Hawaii International Conference on System Sciences, 5-8 January 2015, Kauai, Hawaii, USA, pp. 1218–1226. https://doi-org.tudelft.idm.oclc.org/10.1109/HICSS.2015.148
Nordbø, E. C. A., Raanaas, R. K., Nordh, H., & Aamodt, G. (2019). Neighborhood green spaces, facilities and population density as predictors of activity participation among 8-year-olds: a cross-sectional GIS study based on the Norwegian mother and child cohort study. BMC Public Health, 19(1). https://doi.org/10.1186/s12889-019-7795-9
Palmer, M. A., Hondula, K. L., & Koch, B. J. (2014). Ecological restoration of streams and rivers: shifting strategies and shifting goals. Annual Review of Ecology Evolution and Systematics, 45(1), 247–269. https://doi.org/10.1146/annurev-ecolsys-120213-091935
Paul, M. J., & Meyer, J. L. (2001). Streams in the urban landscape. Annual Review of Ecology and Systematics, 32(1), 333–365. https://doi.org/10.1146/annurev.ecolsys.32.081501.114040
Ranta, E., Vidal-Abarca, M. R., Calapez, A. R., & Feio, M. J. (2021). Urban Stream Assessment System (USAS): An integrative tool to assess biodiversity, ecosystem functions and services. Ecological Indicators, 121. https://doi.org/10.1016/j.ecolind.2020.106980
Reporter, G. S. (2002, August 16). Thousands flee Dresden floods. The Guardian. https://www.theguardian.com/world/2002/aug/16/naturaldisasters.weather
Riley, A. L. (2016). Restoring Neighborhood Streams: Planning, Design and Construction. Island Press.
Roberts, H., Kellar, I., Conner, M., Gidlow, C., Kelly, B., Nieuwenhuijsen, M., & McEachan, R. (2019). Associations between park features, park satisfaction and park use in a multi-ethnic deprived urban area. Urban Forestry & Urban Greening, 46, 126485. https://doi.org/10.1016/j.ufug.2019.126485
Roest, A. H., Weitkamp, G., Van Den Brink, M., & Boogaard, F. (2023). Mapping spatial opportunities for urban climate adaptation measures in public and private spaces using a GIS-based Decision Support Model. Sustainable Cities and Society, 96, 104651. https://doi.org/10.1016/j.scs.2023.104651
Sächsisches Landesamt für Umwelt und Geologie. (2002). Vorläufiger Kurzbericht über die meteorologisch-hydrologische Situation beim Hochwasser im August 2002. https://www.wasser.sachsen.de/download/kb021202.pdf
Sheng, Q., Wan, D., & Yu, B. (2021). Effect of Space Configurational Attributes on Social Interactions in Urban Parks. Sustainability, 13(14), 7805. https://doi.org/10.3390/su13147805
Sugiyama, T., Francis, J., Middleton, N. J., Owen, N., & Giles-Corti, B. (2010). Associations between recreational walking and attractiveness, size, and proximity of neighborhood open spaces. American Journal of Public Health, 100(9), 1752–1757. https://doi.org/10.2105/ajph.2009.182006
Van der Plas, F., Hautier, Y., Ceulemans, T., Alard, D., Bobbink, R., Diekmann, M., Dise, N.B., Dorland, E., Dupré, C., Gowing, D. & Stevens, C. (2024). Atmospheric nitrogen deposition is related to plant biodiversity loss at multiple spatial scales. Global Change Biology 30. https://doi.org/10.1111/gcb.17445
Van Nes, A. (2021). Spatial Configurations and Walkability Potentials. Measuring Urban Compactness with Space Syntax. Sustainability, 13(11), 5785. https://doi.org/10.3390/su13115785
Van Nes, A. & Yamu, C. (2021). Introduction to Space Syntax in Urban Studies. Springer. https://doi.org/10.1007/978-3-030-59140-3
Vert, C., Gascon, M., Ranzani, O., Márquez, S., Triguero-Mas, M., Carrasco-Turigas, G., Arjona, L., Koch, S., Llopis, M., Donaire-Gonzalez, D., Elliott, L. R., & Nieuwenhuijsen, M. (2020). Physical and mental health effects of repeated short walks in a blue space environment: A randomised crossover study. Environmental Research, 188, 109812. https://doi.org/10.1016/j.envres.2020.109812
Völker, S., Heiler, A., Pollmann, T., Claßen, T., Hornberg, C. & Kistemann, T. (2018). Do perceived walking distance to and use of urban blue spaces affect self-reported physical and mental health?_ Urban Forestry & Urban Greening_, 29, 1-9. https://doi.org/10.1016/j.ufug.2017.10.014
Walsh, C. J., Roy, A. H., Feminella, J. W., Cottingham, P. D., Groffman, P. M., & Morgan, R. P. (2005). The urban stream syndrome: current knowledge and the search for a cure. Journal Of The North American Benthological Society, 24(3), 706–723. https://doi.org/10.1899/04-028.1
Wang, J., Xie, C., Liang, A., Jiang, R., Man, Z., Wu, H., & Che, S. (2021). Spatial-Temporal Variation of Air PM2.5 and PM10 within Different Types of Vegetation during Winter in an Urban Riparian Zone of Shanghai. Atmosphere, 12(11), 1428. https://doi.org/10.3390/atmos12111428
Wantzen, K. M., Piednoir, T., Cao, Y., Vazhayil, A. M., Tan, C., Kari, F. G., Lagerström, M., Gerner, N. V., & Sommerhäuser, M. M. (2022). Back to the surface – Daylighting urban streams in a Global North–South comparison. Frontiers in Ecology and Evolution, 10. https://doi.org/10.3389/fevo.2022.838794
8.1 Image References
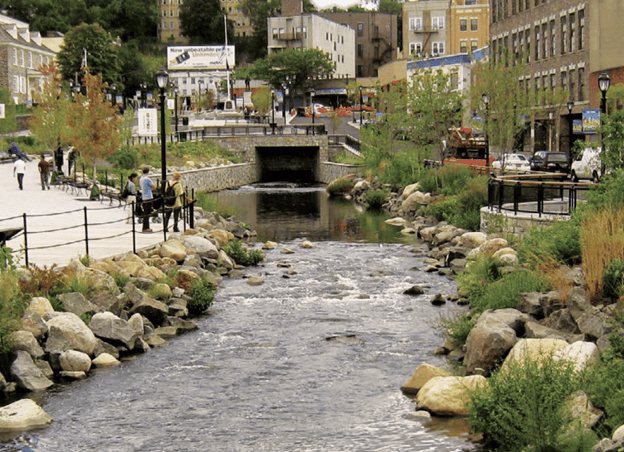
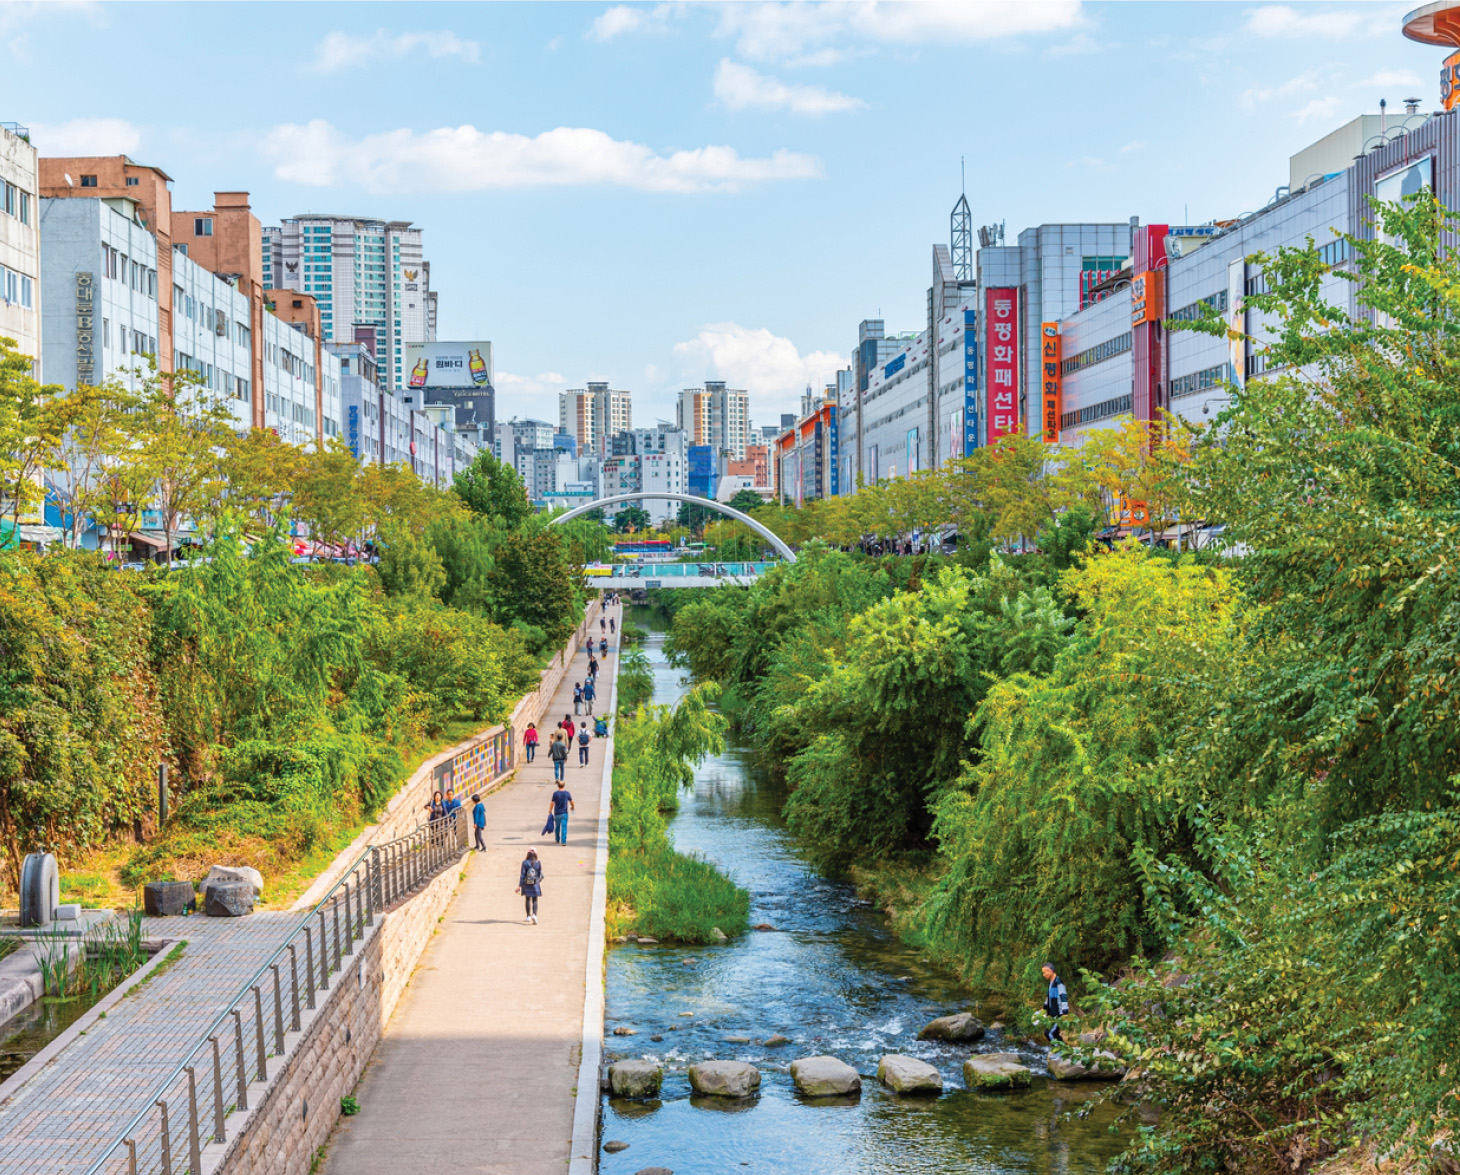
Carrasco, M. (2024, September 12). Re-Naturalization of urban waterways: The case study of Cheonggye Stream in Seoul, South Korea. ArchDaily. https://www.archdaily.com/1020945/re-naturalization-of-urban-waterways-the-case-study-of-cheonggye-stream-in-seoul-south-korea
Chung, T. (2025, June 23). Daylighting a Stream | Bentley Blog | Infrastructure Engineering Software & Solutions. Bentley Blog | Infrastructure Engineering Software & Solutions. https://blog.bentley.com/software/daylighting-a-stream/
Fletcher, T. D., Burns, M. J., Russell, K. L., Hamel, P., Duchesne, S., Cherqui, F., & Roy, A. H. (2024). Concepts and evolution of urban hydrology. Nature Reviews Earth & Environment, 5(11), 789–801. https://doi.org/10.1038/s43017-024-00599-x
Harding, J., Clapcott, J., Quinn, J., Hayes, J., Joy, M., Storey, R., Greig, H., Hay, J., James, T., Beech, M., Ozane, R., Meredith, A., & Boothroyd, I. (2009). Stream habitat assessment Protocols. In School of Biological Sciences, University of Canterbury, Cawthron Institute, National Institute of Water and Atmospheric Research, Institute of Natural Resources, Massey University, Tasman District Council, Environment Canterbury, Otago Regional Council, & Golder Associates, Stream Habitat Assessment Protocols. School of Biological Sciences, University of Canterbury. https://www.envirolink.govt.nz/assets/Envirolink/Stream20Habitat20Assessment20Protocols.pdf
Noviandi, T. U. Z., Kaswanto, R. L., & Arifin, H. S. (2017). Riparian landscape management in the midstream of Ciliwung River as supporting Water Sensitive Cities program with priority of productive landscape. IOP Conference Series Earth and Environmental Science, 91, 012033. https://doi.org/10.1088/1755-1315/91/1/012033
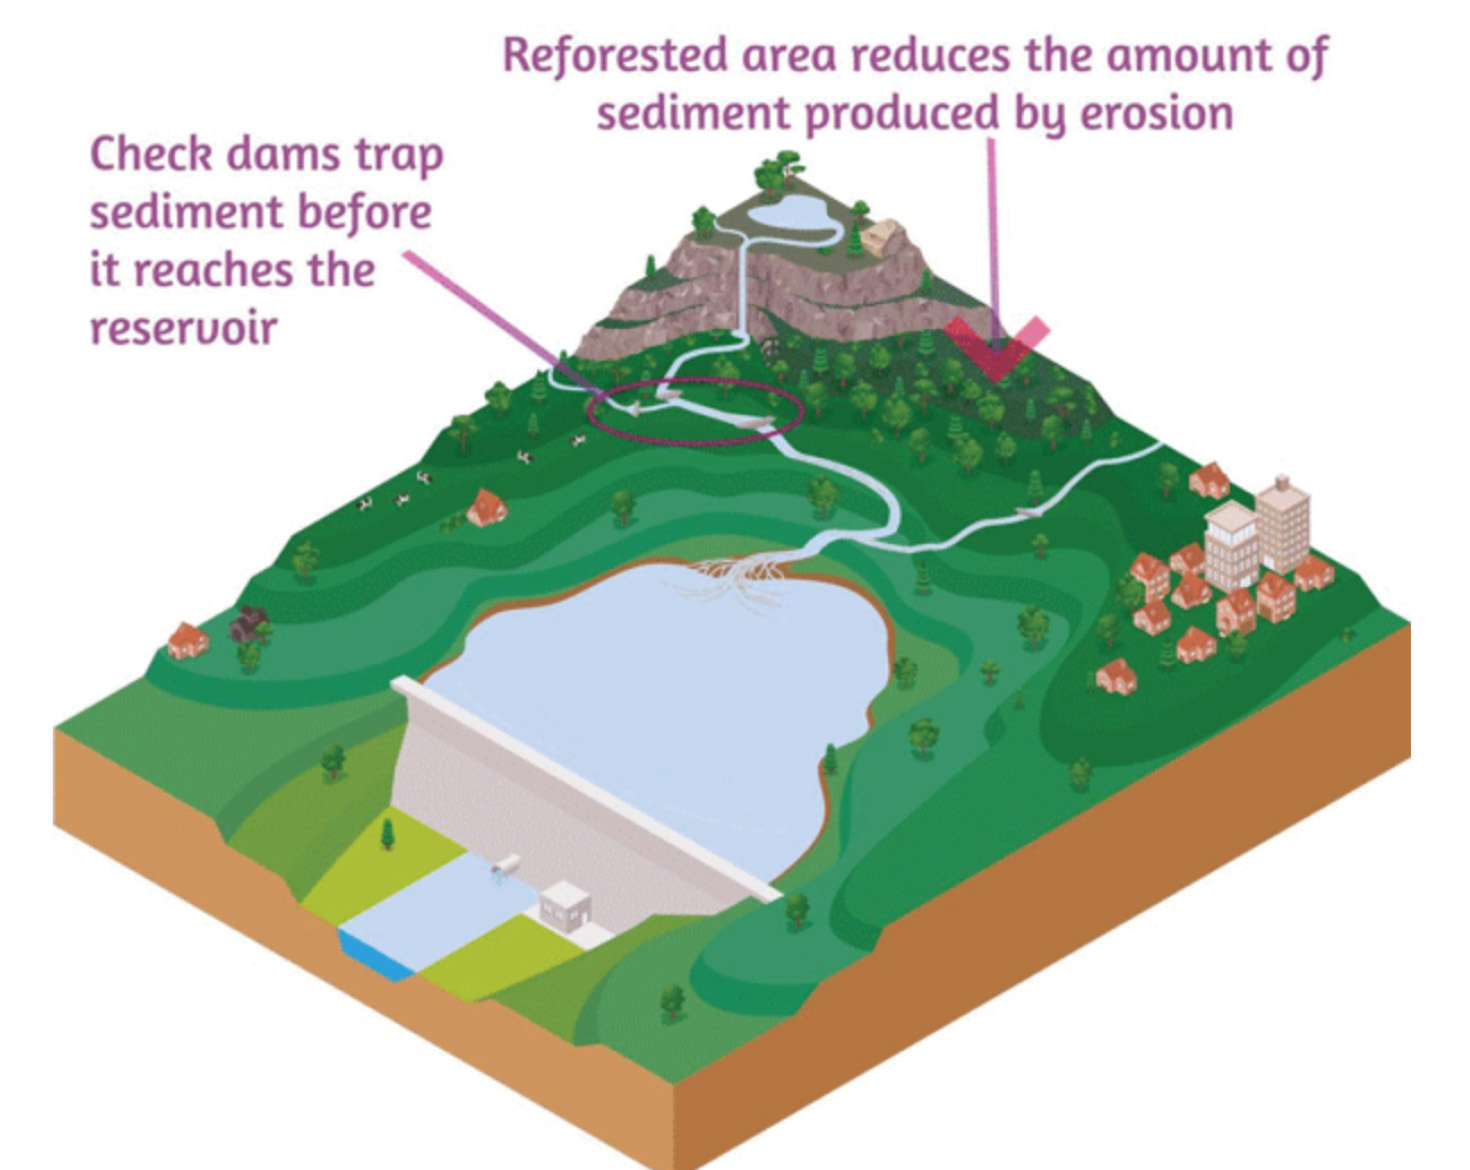
Strategies. (n.d.). https://www.hydropower.org/sediment-management/sediment-management-strategies
Qunli National Urban Wetland by Turenscape. (n.d.). Landezine. https://landezine.com/qunli-national-urban-wetland-by-turenscape/
What is River Restoration? (n.d.). The River Restoration Centre. https://www.therrc.co.uk/why-restore
8.2 Data Set Bibliography
OpenDataPortal Dresden. (2005). Versickerungseigenschaften des Untergrundes [WFS data]. https://opendata.dresden.de/informationsportal/?open=1&result=FA8DAE54AB6C41BAA187E5B1CC990831#app/mainpage (Accessed: May 20, 2025). Accessed via QGIS.
OpenDataPortal Dresden (2025A). Adressen. [Dataset]. Retrieved May 18th from https://opendata.dresden.de/informationsportal/?open=1&result=2A1A54497DAB4B928E8FD7219860AF14#app/mainpage
OpenDataPortal Dresden (2025B). Spielplätze. [Dataset]. Retrieved May 18th from https://opendata.dresden.de/informationsportal/?open=1&result=2A1A54497DAB4B928E8FD7219860AF14#app/mainpage