Linking to GEOS 3.13.0, GDAL 3.8.5, PROJ 9.5.1; sf_use_s2() is TRUE
Attaching package: 'dplyr'
The following objects are masked from 'package:stats':

    filter, lag
The following objects are masked from 'package:base':

    intersect, setdiff, setequal, union
Introduction
In this course, we explored urban stream restoration in Poznań, Poland, using two primary methodological approaches: Multi-Criteria Decision Analysis (MCDA) and Typology Construction. For each method, we identified relevant objectives and formulated research questions tailored to the respective analytical framework.
In the case of MCDA, the selection of criteria and the rationale behind their inclusion will be detailed in the Methods section, while the corresponding analytical outcomes will be presented in the Results section.
For Typology Construction, we introduce the objective of generating meaningful clusters that categorize spatial units adopted from MCDA based on shared characteristics. In the context of stream restoration in Poznań, a specific research question is formulated to align with this methodological approach. To address this question, a set of variables is selected, and the rationale behind the selection of these variables is grounded in both theoretical relevance and practical applicability to the local context.
The methodological framework for clustering relies on the K-means algorithm, which will be detailed in the Methods section. The resulting typology, including the characteristics of each cluster and the reasoning behind their labeling, will be presented in the Results section.
Finally, the Discussion section will provide an evaluation of the outcomes from both methods, including an assessment of the methodological robustness and limitations, as well as reflections on the implications of the typology for future urban stream restoration strategies in Poznań.
MCDA
| Finding out where to prioritize actions that improve biodiversity, climate adaptation and quality of life |
Enrich Biodiversity |
Which areas have a low ecological value and are in need of restoration to enrich the biodiversity? |
| Promote Climate Adaptation |
Which areas are most in need of interventions to promote climate adaptation? |
| Improve Quality of Life |
Which areas are most in need of neighborhood-oriented interventions that improve the quality of life of local residents? |
Typology Construction
| Finding out patterns of research areas in order to come up with tailored solutions |
Patterns and Typology |
What patterns can be identified from the spatial units based on selected relevant characteristics? |
Team Roles and Explanations
- Stepan: Data analyst
Data analyst and Presentation lead.
- Roger: Landscape architect
Landscape expert and Mapping
- Yaying: Mapping Lead
Data visualization and Mapping.
- Jaee: Research Lead
Oversees background research and Mapping.
Research Background
What is Urban Stream Restoration and Why is it necessary?
Urban stream restoration refers to the process of returning degraded urban rivers and streams to a more natural, functional, and integrated state within the city’s urban ecosystem and social fabric. Traditionally focused on improving only the hydrological functions and ecological health—such as reducing pollution, restoring habitats, and stabilizing banks—urban stream restoration is increasingly recognized as a means to enhance social connectivity. (Kondolf and Pinto, 2017)
Urban rivers are not merely ecological corridors but also social public spaces that allow for urban movement. They host space for interaction of people, ideas, and cultural practices. This shift in perspective makes restoration not only an environmental necessity but also a social and cultural imperative. This asks for an integrated approach which is beyond technocratic engineering solutions.
What is the Context of Urban Stream Restoration in Poznan?
- In Poznan, streams are interwoven into different types of urban fabrics, which indicates that we need to choose the suitable restoration strategy based on specific context. This also becomes our main idea when formulating the research questions.

- The streams end up in Warta River Valley, which suggests that we should also have River Warta included in the research scope together with the stream system. This helps us develop our spatial units of study.

What is the conceptual framework guiding the research?

From the background research, we come up with several key values that we would like to address in the working process, which are transformed into two goals: to develop the urban streams in Poznan into not only ecological corridors but also social public spaces which improve the environmental quality of the city. From those two goals, we identify the physical spaces we would be tackling, which is the streams as well as some relevant spaces in the vicinity. This also works as a base for the justification of the spatial unit system we adopt.
Methods
The two methods adopted in this research each has different focus but at the same time sharing a common basis. The results we expect from the two methods can be combined into a guidance for urban stream restoration actions, in which the MCDA will answer the question of “where” according to the synthetic assessment, while the typology construction will mostly focus on “what”, as it helps to identify patterns derived from the characteristics of the spatial units.

The relevant indicators for this research are put into a shared pool of criteria. For each method, several of them are selected and categorized to align with the different focuses.

Spatial Unit of Analysis
Why Hexagon Grid and What are the Parameters?

Hexagons:
For the spatial analysis, the study area was subdivided using a hexagonal grid, which served as the primary unit of analysis. The choice of hexagons was narrowed down by several methodological advantages.
Hexagonal cells maintain equal distance to all neighboring cells, which supports reduces directional bias in spatial calculations.
The use of hexagons helps to minimize edge effects that commonly arise in grid-based spatial analysis, thereby ensuring more consistent and accurate representation of spatial phenomena.
Diameter = 500m:
- 5-10min walk distance
- Integrate stream restoration intervention into urban life in the vicinity
- Reasonable amount of cells in the whole city area

Buffer Zone = 300m:
- Potential area under the influence of the streams for local residents
- Suitable for collecting relevant context information
MCDA
MCDA Structure

Multi-Criteria Decision Analysis (MCDA) is a subfield of operations research that systematically evaluates multiple, often conflicting, criteria in the decision-making process. The application of the MCDA methodology begins with the formulation of a primary goal. This overarching goal is then decomposed into specific objectives, each of which is translated into a research question. For each research question, a set of criteria is identified to assess various dimensions relevant to the objective. These criteria are subsequently assigned weights to reflect their relative importance in influencing the overall outcome.
The evaluation culminates in the development of a synthetic map for each research question, which integrates the weighted criteria into a comprehensive spatial representation. These maps serve as analytical tools that encapsulate the combined perspectives of multiple stakeholders, thereby supporting informed and balanced decision-making.
In the context of our study on urban stream restoration in Poznań, the principal objective is to enhance the resilience of the urban environmental system. In this study, resilience is conceptualized through three key dimensions: Enhancing Biodiversity, Promoting Climate Adaptation and Improving Quality of Life. Each of these dimensions is formulated as a distinct research question, for which multiple relevant evaluation criteria are selected to guide the analysis.
MCDA Indicators and Argumentation

- Enrich Biodiversity
| 1-1 |
Healthy Vegetation Density |
the areas with the most active photosynthesis process have a better vegetation health condition for enriching biodiversity |
NDVI –> Threshold > 0.2 –> Zonal Statistics –> Mean –> Normalization |
Copernicus Sentinel 2 |
Gandhi, 2015 |
| 1-2 |
Natural Land Use Density |
the natural land use along the streams provide legislative and administrative base for nature-based interventions and also indicates a more natural environment |
Landuse Map–> Assigning All Green a Single Category > Join Attributes by field value–> Areas per grid assigned to each grid –> Normalization |
OSM Data |
|
| 1-3 |
Species Richness |
different types of natural land use indicate different degree of species richness which provides different condition for interventions aiming for enriching biodiversity, for example forests imply higher biodiversity and farmlands lower |
Give biodiversity value –> add biodiversity values of overlapping shapes together –> Erase duplicate geometry –> use only higher biodiversity value –> Multiply max biodiversity value with the area –> Add Biodiversity values from same hex –> Normalization |
OSM Data |
|
| 1-4 |
Nuisance from Industries |
industries in general cause nuisance (noise, pollution, odor, etc) which hinder biodiversity development |
Landuse Map sorted only the industries –> Join Attributes by field value–> Amount of industries assigned per grid –> Normalization |
OSM Data |
|
| 1-5 |
Nuisance from Urban Barriers |
roads with a high maxspeed become dangerous urban barriers preventing animals from migrating and thus hindering the biodiversity |
road data –> Threshold: maxspeed >= 40km/h –> Intersection –> Sum of length in each cell –> Normalization |
OSM Data |
|
- Promote Climate Adaptation
| 2-1 |
Risk of Flooding |
there have been major floodings in Poznan during the last few years, and the areas with higher flooding risk are more in need of interventions that promote climate adaptations |
flooding depth map –> subtract permenant waterbody –> Zonal Statistics –> Sum –> Normalization |
EFAS |
|
| 2-2 |
Density of Impermeable Surfaces |
the areas with more amounts of impermeable surfaces are more vulnerable against flooding during future extreme rainfalls |
Landcover –> Zonal Statistics –> Sum –> Normalization |
ESA-Worldcover |
|
| 2-3 |
Heat Risk Index |
the areas with more hot nights and more severe urban heat island effect (UHI) are more vulnerable towards future extreme climate, thus more in need of interventions promoting climate adaptation |
|
|
|
| 2-4 |
River Sinuosity |
the higher sinuosity of a stream indicate that it is in a more natural form and helps to diverse flows and habitats, while the straighter streams need interventions that restore it into a more natural shape |
stream waterway data –> intersect with grid –> calculate the length of line that falls into each grid –> divide the length by the distance between the start and end intersection point of the line with the grid –> Normalization |
OSM Data |
|
- Improve Quality of Life
| 3-1 |
Residents Number |
the areas with larger numbers of residents see bigger possibility of an active urban life with community-oriented interventions carried out along the streams |
population data –> Zonal Statistics –> Sum –> Normalization |
hub.worldpop.org |
|
| 3-2 |
Urbanized Land Use Density |
the urbanized land use along the streams provide legislative and administrative base for community-oriented interventions |
Land use Map–> Assigning Broader Categories (‘residential’, ‘commercial’, ‘industrial’, ‘greens’) > Join Attributes by field value–> Sum of Areas per Landuse assigned to each grid–> Normalization |
OSM Data |
|
| 3-3 |
People Attraction Density |
if the area already contains some attractions for people, it has a good base to become a more active space in the future |
point of interest data –> Count Points in Polygon –> Normalization |
OSM Data |
|
| 3-4 |
Local Centrality Index |
this index is calculated through local integration analysis, which shows where the most vital local centers are and the areas with higher local centrality will be more suitable for community-oriented interventions |
Angular Integration (800M) –> Intersection –> join value by location (Group stats) –> Mean –> Normalization |
OSM Data |
|
| 3-5 |
Public Transport Accessibility |
the areas that are more accessible via public transport are more suitable for life-quality-improving interventions |
public transport station data –> Count Points in Polygon –> Normalization |
OSM Data |
|
| 3-6 |
Pedestrian Accessibility Index |
the attraction betweenness analysis shows which roads are more frequently chosen leading to certain attractions (in this case streams), and the high value in this analysis indicates that the stream in those areas are more accessible for pedestrians, thus more suitable for community-oriented solutions |
Attraction Betweeness (800M) destination set as points along streams, distance = 500m –> Intersection –> join value by location (Group stats) –> Mean –> Normalization |
OSM Data |
|
Typology Construction
Typology Construction is a method used to classify areas or elements based on shared combinations of characteristics. In the context of urban stream restoration, our aim in applying this method is to incorporate variables from multiple domains, such as ecological, social, and morphological, into a clustering process that reveals distinct area types. By identifying the defining features of each cluster, we can better determine which types of restoration strategies are most suitable for each group.
Two key components must be defined for this method. The first is the spatial unit: we adopt the same unit used in the MCDA process, which is hexagonal grids with a diameter of 500 meters, applied along streams with a 300 meter buffer zone. The second is the set of relevant variables,which are selected from key indicators used in the MCDA analysis and categorized to effectively represent the characteristics of each domain.
Chosen Fields
From ,
| Risk Indicators |
Heat Risk index(hr) |
aggregated hot nights and UHI max in the unit |
| Impermeable Surface Density(is) |
percentage of impermeable surfaces in the unit |
| Healthy Vegetation Density(hv) |
the activeness of photosynthesis in the unit |
| Urbanization Indicators |
Stream Navigability Index(ts) |
the density of roads in the unit |
| Residents Number Index(rn) |
the number of residents living in the unit |
Reproducibility Self-Assessment
While the project aimed to follow a structured and re-applicable approach, several limitations affect the reproducibility of the analysis.
One key concern is the reliance on OpenStreetMap (OSM) data, which, while being openly accessible and widespread, varies in quality and completeness across different regions. Especially in regions like Poznan which doesn’t have extensive documentation. As a result, data inputs may not be consistent or verifiable, potentially affecting the reliability of the output if replicated.
Furthermore, the grid-being a 500-meter grid resolution—served as a practical framework aligning with walkability considerations. However, this leads to the loss of granularity and information. The generalization of spatial characteristics at this level may lead to variations. A finer resolution or a multi-scalar approach could help mitigate this issue and improve reproducibility across context.
Results
MCDA
Results of Indicators
1.Enrich Biodiversity
1-1. Healthy Vegetation Density
Reflection:
The healthy index of vegetation shows the areas where there is more photosynthetic activity and therefore more healthy vegetation. It’s based on the NDVI index.
Limitation:
While NDVI is a widely used for vegetation health, it primarily measures photosynthetic activity. This can lead to misleading results in certain cases. For example, certain invasive can show high NDVI values but harm native biodiversity. Similarly, monoculture plantations (e.g., palm oil or eucalyptus) may register as “healthy” vegetation despite offering limited ecological value. Additionally, vegetation under stress from pollutants, pests, or soil degradation may still photosynthesize temporarily and reflect high NDVI values, masking underlying problems.
1-2. Natural Land Use Density
Reflection:
The natural land use density shows the difference between urban and natural land use, visualizing the tiles with the higher area of green space.
Limitation:
Although this metric provides a useful approximation of green cover and potential surface permeability, a higher green value does not necessarily correspond to higher ecological quality or biodiversity. Furthermore, the reliance on OpenStreetMap (OSM) data introduces additional uncertainty, as it tends to generalize land use categories and may lack detail or accuracy in certain areas, which can distort the results especially in transitional zones or informal landscapes.
1-3. Species Richness
Reflection:
Species richness shows the places where based on an understanding of the type of green space, the richness of species is higher
Limitation:
Although this method is more detailed and knowldege and literature informed, uncertainties can still arise due to gaps in data or outdated ecological classifications. Additionally, local variations or undocumented species may not be captured, affecting the accuracy of the richness estimates.
1-4. Nuisance from Industries
Reflection:
Grids with more presence of industries are considered places more exposed to the different contaminants resulting from the industrial activity, creating dangerous spaces for the ecosystem in these spaces.
Limitation:
The analysis considers proximity to industrial areas but does not account for actual emission levels or types of pollutants. This may misrepresent the impact, as some industries might be low-emission or environmentally regulated, while others may cause significant air, water, or soil pollution.
1-5. Nuisance from Urban Barriers
Reflection:
Roads with maxspeed over 40km/h will be more dangerous for animals to cross, thus becoming barriers hindering biodiversity in the area
Limitation:
The assessment is based solely on speed limits, without considering road width, traffic volume, or mitigation infrastructure like wildlife crossings. These factors can significantly influence how much a road actually disrupts animal movement and habitat connectivity.
Saaty Matrix:

- Promote Climate Adaptation
2-1. Risk of Flooding
Reflection:
From the flooding depth map (return period = 50 years) we can calculate the areas most likely to be flooded during extreme climate. Our hypothesis is that areas with higher flood risk require targeted interventions.
Limitation:
The flood map is model-based and may not reflect local drainage conditions or recent infrastructure upgrades. Temporal variations and smaller flood events are not considered.
2-2. Density of Impermeable Surfaces
Reflection:
Surface permeability is critical for climate adaptation as it supports flood mitigation, groundwater recharge, and urban cooling. Our hypothesis is that permeability can be estimated from landcover maps.
Limitation:
Landcover maps may not capture small-scale permeability features like green roofs or permeable pavements. The classification may also generalize surface types.
2-3. Heat Risk Index
Combining UHI max (as defined by https://support.tygron.com/wiki/UHI_formula_(Heat_Overlay) ) with the number of Hot nights (>22C) observed between 2015 - 24 in the summer months.
2-4. River sinuosity
Reflection:
Higher sinuosity indicates a more natural river form that supports diverse flows and habitats, while straighter channels may need ecological restoration.
Limitation:
Channelization history and hydrological data are not included.
Saaty Matrix:

- Improve Quality of Life
3-1. Residents Number
Reflection:
Areas with higher residential populations present greater potential for vibrant urban life and community-focused interventions along the streams.
Limitation:
Population density does not reflect actual engagement levels always. High density may also indicate limited public space availability.
3-2. Urbanized Land Use Density
Reflection:
Urban land use along streams provides a legal and administrative framework that can support community-focused developments.
Limitation:
Urban land use doesn’t always translate to accessible or usable public space. It may also include industrial/ military lands or private areas that limit intervention feasibility.
3-3. People Attraction Density
Reflection:
Areas with existing attractions offer a strong foundation for developing more active and engaging public spaces in the future.
Limitation:
Attraction data may overlook informal or seasonal activities. Existing attractions may also cause congestion or compete with new interventions.
3-4. Local Centrality
Reflection:
Local integration analysis identifies the most vital centers, where higher centrality indicates better suitability for neighborhood-oriented interventions.
Limitation:
Centrality metrics are purely spatial and may not reflect actual land use or social dynamics.
3-5. Public Transport Accessibility
Reflection:
Locations with better access to public transport are more suitable for interventions aimed at enhancing quality of life and public space use.
Limitation:
Accessibility may vary significantly at different times of day and the index may not account for frequency, affordability, or last-mile connectivity.
3-6. Pedestrian Accessibility Index
Reflection:
Betweenness analysis highlights routes commonly used by pedestrians to reach key destinations like streams, identifying areas where walkability supports public interventions.
Limitation:
The analysis assumes rational route choices and may not reflect barriers like poor sidewalks or unsafe crossings.
Saaty Matrix:

Aggregated Results for Research Questions
- Which areas have a good base for implementing nature-based restoration solutions that nurture better biodiversity?
When the area has higher index, it means: (relatively)
-More people live in this area
-The stream in/near this area has good public transport and/or pedestrian accessibility
-The area is close to existing settlement center
-Already some attractions for people are in this area
-Land Use in this area allow community-oriented intervention
- Which areas are most in need of interventions to promote climate adaptation?
When the area has higher index, it means: (relatively)
-More people live in this area
-The stream in/near this area has good public transport and/or pedestrian accessibility
-The area is close to existing settlement center
-Already some attractions for people are in this area
-Land Use in this area allow community-oriented intervention
- Which areas are most suitable for neighborhood-oriented interventions that improve the quality of life of local residents?
When the area has higher index, it means: (relatively)
-More people live in this area
-The stream in/near this area has good public transport and/or pedestrian accessibility
-The area is close to existing settlement center
-Already some attractions for people are in this area
-Land Use in this area allow community-oriented intervention
- Which areas which are most in need of intervention through integrated interventions that enhance biodiversity, support climate adaptation, and improve neighborhood quality of life?
When the area has higher index, it means: (relatively)
-More people live in this area
-The stream in/near this area has good public transport and/or pedestrian accessibility
-The area is close to existing settlement center
-Already some attractions for people are in this area
-Land Use in this area allow community-oriented intervention
Typology Construction
Cluster Centers - Scaled value
| 1 |
-1.030 |
-0.837 |
0.947 |
-0.700 |
-1.020 |
| 2 |
0.769 |
1.095 |
-0.663 |
2.023 |
1.287 |
| 3 |
0.494 |
0.579 |
-0.367 |
0.020 |
0.705 |
| 4 |
1.446 |
1.988 |
-1.451 |
0.937 |
1.248 |
| 5 |
-0.308 |
-0.400 |
0.580 |
0.069 |
0.143 |
| 6 |
0.310 |
-0.686 |
-0.738 |
-0.808 |
-0.818 |
Cluster value descriptors
| 1 |
Very Low |
Low |
High |
Low |
Very Low |
| 2 |
High |
High |
Low |
Very High |
High |
| 3 |
Moderate |
Moderate |
Moderate |
Neutral |
Moderate |
| 4 |
Very High |
Very High |
Very Low |
High |
High |
| 5 |
Slightly Low |
Slightly Low |
Slightly High |
Neutral |
Neutral |
| 6 |
Slightly High |
Low |
Low |
Low |
Low |
Cluster Descriptions
Cluster 1: Green Low-Density Residential Description: Low urban stress, high vegetation, low impermeability, low population.
Needs: Likely not a priority for restoration but valuable for conservation.
Mean distance from cluster center: 0.990
Actions:
Preserve existing vegetation buffers.
Maintain low-impact development.
Use as reference site for restoration benchmarking.
Cluster 2: Dense Urban Hotspot Description: High heat, impermeability, and population; poor vegetation; but highly navigable stream.
Needs: Urgent cooling and greening interventions.
Mean distance from cluster center: 1.07
Actions:
Implement green roofs, urban forestry, and reflective materials.
Restore vegetated riparian zones.
Improve stormwater management with permeable surfaces.
Use stream navigability as a recreational anchor for engagement.
Cluster 3: Transitional Urban Zone Description: Balanced profile across indicators.
Needs: Moderate intervention to maintain equilibrium.
Mean distance from cluster center: 1.03
Actions:
Promote nature-based solutions before conditions degrade.
Targeted vegetation improvements and stormwater retrofits.
Cluster 4: High-Risk Urban Core Description: Severe environmental stress—highest heat, impermeability, lowest vegetation; dense population.
Needs: Comprehensive transformation.
Mean distance from cluster center: 1.12
Actions:
Major greening (parks, bioswales, green corridors).
Riparian daylighting or stream restoration projects.
Community outreach to reduce impermeability (e.g., green driveways).
Resilience planning with local stakeholders.
Cluster 5: Stable Suburban Description: Slight stress, relatively healthy.
Needs: Low-intensity maintenance.
Mean distance from cluster center: 0.997
Actions:
Encourage private vegetation upkeep.
Light interventions to enhance stormwater infiltration.
Monitor for encroaching stressors (urban sprawl).
Cluster 6: Degraded Low-Density Fringe Description: Sparse population, low vegetation, moderate heat.
Needs: Ecological repair more than social infrastructure.
Mean distance from cluster center: 1.18
Actions:
Passive reforestation or rewilding.
Target invasive species removal.
Use as buffer or ecological corridor zone.
Discussion
The method of scientific, data driven analysis and design used in this project offers a structured, transparent, and reproducible way to understand complex urban and ecological systems. Using these tools allow for systematic evaluation and helps to ground design interventions in measurable evidence rather than purely subjective factors.
However, while the strengths of this data centric process are clear, the analysis must be approached with a critical eye. Much of the spatial data used, particularly in the case of Poznan is from OSM and is naturally crowd-sourced which varies in levels of completeness and sometimes accuracy.
For example, initially while running angular integration and angular betweenness analyses to calculate street centrality, we encountered some questionable results. This was primarily due to inaccuracies and errors in the road network data, which was not perfectly drawn or updated. These data oversights led to outputs that deviated noticeably from what would be expected based on the obvious intuition, showing how the quality of input data can significantly affect computational results.
Alongside computational analysis, incorporating intuition, reasoning, and contextual understanding is important to create a well grounded project.
Besides that, now reflecting back, the scale of the grid we chooses although being optimal walking distance and allowed for manageable data handling and clear comparison across areas. However, it also inevitably generalized a lot of data, leading to a loss of finer spatial detail and information that smaller scales might reveal if run the same processing differently.
During typology construction particularly, by the buffer to select the most suitable grid around streams- While effective for spatial structuring, this method does not always coincide with the exact stream cells. An alternative approach could be intersecting grids directly with the stream. Which might yield different and potentially more relevant results for restoration.
The river Warta was included alongside smaller streams, recognizing that they form an interconnected ecological and social network influencing the wider landscape. A key limitation is that recommended ‘actions’ proposed were based solely on typology construction, missing the opportunity to integrate MCDA findings, which could have strengthened and nuanced the conclusions.
Lastly, when reflecting on this method, we wondered that if this process included involving stakeholders and their perspectives in rating MCDA criteria and typology categories, they could significantly affect outcomes. Alternatively this could have biases from vested interests and be unscientific in terms of transparency and legitimacy.
In conclusion, while data driven analysis is a full-proof and logical, it must be complemented with critical reflection and inclusive processes for any urban interventions.
Bibliography
- Copernicus Sentinel 2. (n.d.). Normalized Difference Vegetation Index (NDVI) [Geotif]. https://dataspace.copernicus.eu/explore-data/data-collections/sentinel-data/sentinel-2
- ESA-Worldcover. (n.d.). Landcover [Geotif]. https://esa-worldcover.org/en/data-access
- European Flood Awareness System. (n.d.). Flooding Depth Map EFAS [Geotif]. https://european-flood.emergency.copernicus.eu/efas_frontend/#/home
- Kondolf, G. M., & Pinto, P. J. (2017). The social connectivity of urban rivers. Geomorphology, 277, 182–196. https://doi.org/10.1016/j.geomorph.2016.09.028
- Open Street Maps. (n.d.-a). OSM City Bounderies [Dataset; ESRI Shapefile]. https://download.geofabrik.de/europe.html
- Open Street Maps. (n.d.-b). OSM Green Spaces [ESRI Shapefile]. https://download.geofabrik.de/europe.html
- Open Street Maps. (n.d.-c). OSM Land Use [ESRI Shapefile]. https://download.geofabrik.de/europe.html
- Open Street Maps. (n.d.-d). OSM Points of Interest (points) [ESRI Shapefile]. https://download.geofabrik.de/europe.html
- Open Street Maps. (n.d.-e). OSM Railways [ESRI Shapefile]. https://download.geofabrik.de/europe.html
- Open Street Maps. (n.d.-f). OSM Roads [ESRI Shapefile]. https://download.geofabrik.de/europe.html
- Open Street Maps. (n.d.-g). OSM Water Bodies [Dataset; ESRI Shapefile]. https://download.geofabrik.de/europe.html
- Open Street Maps. (n.d.-h). OSM Waterways [ESRI Shapefile]. https://download.geofabrik.de/europe.html
- WorldPop. (n.d.). Population count 100m Poland in the year 2020 [Geotif]. https://hub.worldpop.org/geodata/summary?id=50049
Appendix
3-4. Stream Navigability
Processing:100m buffer around waterways –> intersect buffer with roads –> split roads every 10m –> count road segments in Polygon –> Normalization
(placeholder 4-8)
Accuracy/Reflection:
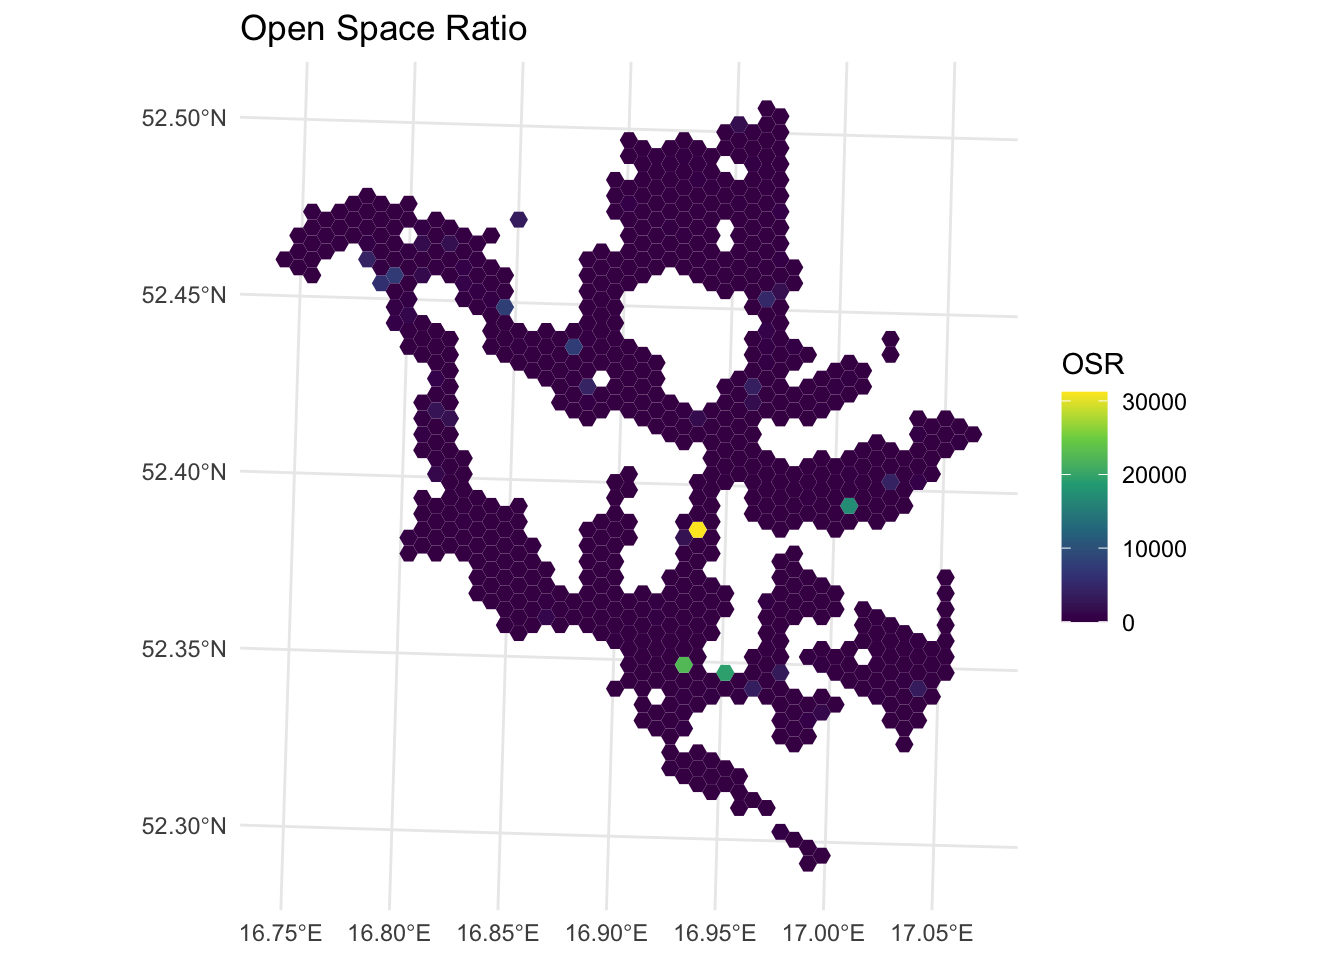
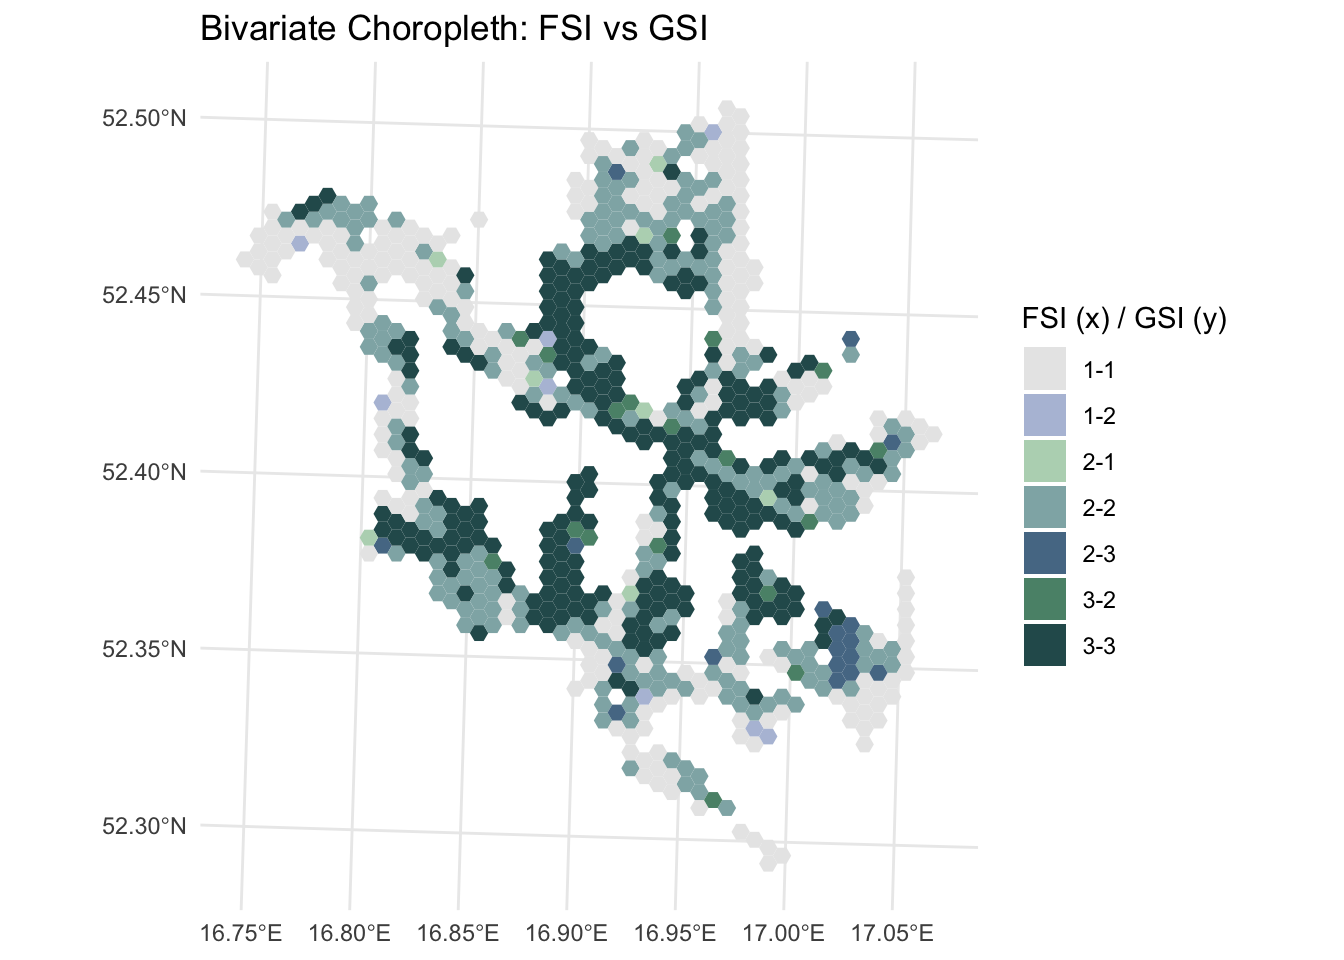
3-7. Density Indicators (FSI/GSI/OSR) Developed from N-DSM. To create N-DSM, DSM - DEM, verify results filter out inconsistent height values. Calculate floorspace sum: calculate assumed number of floors by performing height / 3 (assumed that each floor is 3m), floorspace = area of polygon * number of floors. Calculate footpring by calculating the area of the polygon. Perform spatial join, calculating the sum of both floorspace and footprint. Perform FSI, GSI, and OSR post processing in R as follows:
Degree or Urbanization
Initial Exploration- Degree of urbanization Computed through ratio of ‘green:urbanized’ land