Georeferencing and Digitizing
Duration: 30-40 minutes
By the end of this tutorial, you will be able to:
- Install and use the Freehand Raster Georeferencer plugin
- Georeference a scanned map or image to real-world coordinates
- Use control points to align historical maps with current data
- Digitize vector features (points, lines, polygons) from georeferenced maps
- Create and edit vector layers with proper attributes
- Understand transformation types and their appropriate uses
- QGIS (version 3.x or higher)
- Freehand Raster Georeferencer plugin
- Active internet connection (for PDOK aerial photos)
- Data files:
buurten.gpkg(from previous exercise with Rotterdam neighbourhoods)Ruimte_voor_toekomstige_dijkversterking.jpg(historical map or plan to be georeferenced)
Introduction
Georeferencing is the process of assigning real-world coordinates to a scanned map, aerial photo, or any image that doesn’t have spatial reference information. This is essential when working with historical maps, old plans, paper maps, or any non-digital cartographic material.
Digitizing is the process of tracing features from a georeferenced image to create vector data (points, lines, or polygons). This allows you to extract information from maps and make it usable for spatial analysis.
In this tutorial, you’ll georeference a historical map of part of Rotterdam and digitize features from it, comparing them with current aerial imagery.
Georeferencing links the pixels of a raster image to real-world geographic coordinates. You do this by identifying Ground Control Points (GCPs) - locations that you can identify both on your unreferenced image and on a georeferenced map or layer. QGIS then uses these points to calculate a mathematical transformation that warps your image to fit the coordinate system.
- Linear: Requires 3+ points. Simple scaling, rotation, and translation. Good for maps that are already fairly accurate.
- Helmert: Requires 2+ points. Preserves angles and scale uniformity. Good for scanned maps.
- Polynomial (1st, 2nd, 3rd order): Requires increasing numbers of points (6, 10, 15+). Can handle more complex distortions. Higher orders can introduce warping artifacts.
- Thin Plate Spline (TPS): Requires 10+ points. Flexible local warping. Good for maps with local distortions.
For most historical maps, Polynomial 1st or 2nd order works well.
Steps
Part 1: Setting Up Your Project
Install the Freehand Raster Georeferencer plugin:
- Go to
Plugins>Manage and Install Plugins... - Click on the
Alltab - Search for “Freehand raster georeferencer”
- Select the plugin and click
Install Plugin - Click
Close
NoteThe Freehand Raster Georeferencer plugin provides an interactive way to georeference images directly in the QGIS map canvas, making it easier to align your image with reference data in real-time.
- Go to
Start a new QGIS project:
- Go to
Project>New(or press Ctrl+N) - Save your project immediately:
Project>Save As... - Name it
georeferencing_exercise.qgzin your working folder
- Go to
Set the project CRS:
- Go to
Project>Properties>CRS - Set to EPSG:28992 (Amersfoort / RD New - Dutch coordinate system)
- Click
OK
- Go to
Part 2: Loading Reference Data
Import neighbourhood boundaries:
- Go to
Layer>Add Layer>Add Vector Layer... - Click the
...button next to “Vector Dataset(s)” - Navigate to your
part1_datafolder and selectbuurten.gpkg - Select the
buurtenlayer (the individual neighbourhoods, not dissolved) - Click
AddthenClose - Style this layer with a transparent fill and a visible boundary (e.g., red outline, 0.5mm width)
- Go to
Import orthophoto (aerial imagery):
You have two options:
Option A: Use locally saved orthophoto (if you exported one in the previous exercise)
- Go to
Layer>Add Layer>Add Raster Layer... - Navigate to your exported orthophoto file
- Click
Add
Option B: Import from PDOK (recommended for this exercise)
- Open the Data Source Manager (Ctrl+L)
- Select the WMS / WMTS tab
- If you already have the PDOK Aerial Photos connection from the previous exercise, select it
- If not, create a new connection:
- Click
New - Name: PDOK Aerial Photos
- URL:
https://service.pdok.nl/hwh/luchtfotorgb/wms/v1_0 - Click
OK
- Click
- Select the connection and click
Connect - Select the
Actueel_orthoHRlayer - Click
AddthenClose
- Go to
Arrange your reference layers:
- In the Layers panel, ensure the order is:
buurten(on top)- Aerial photo (at bottom)
- Zoom to the extent of your Rotterdam neighbourhoods
- This will be your reference for georeferencing
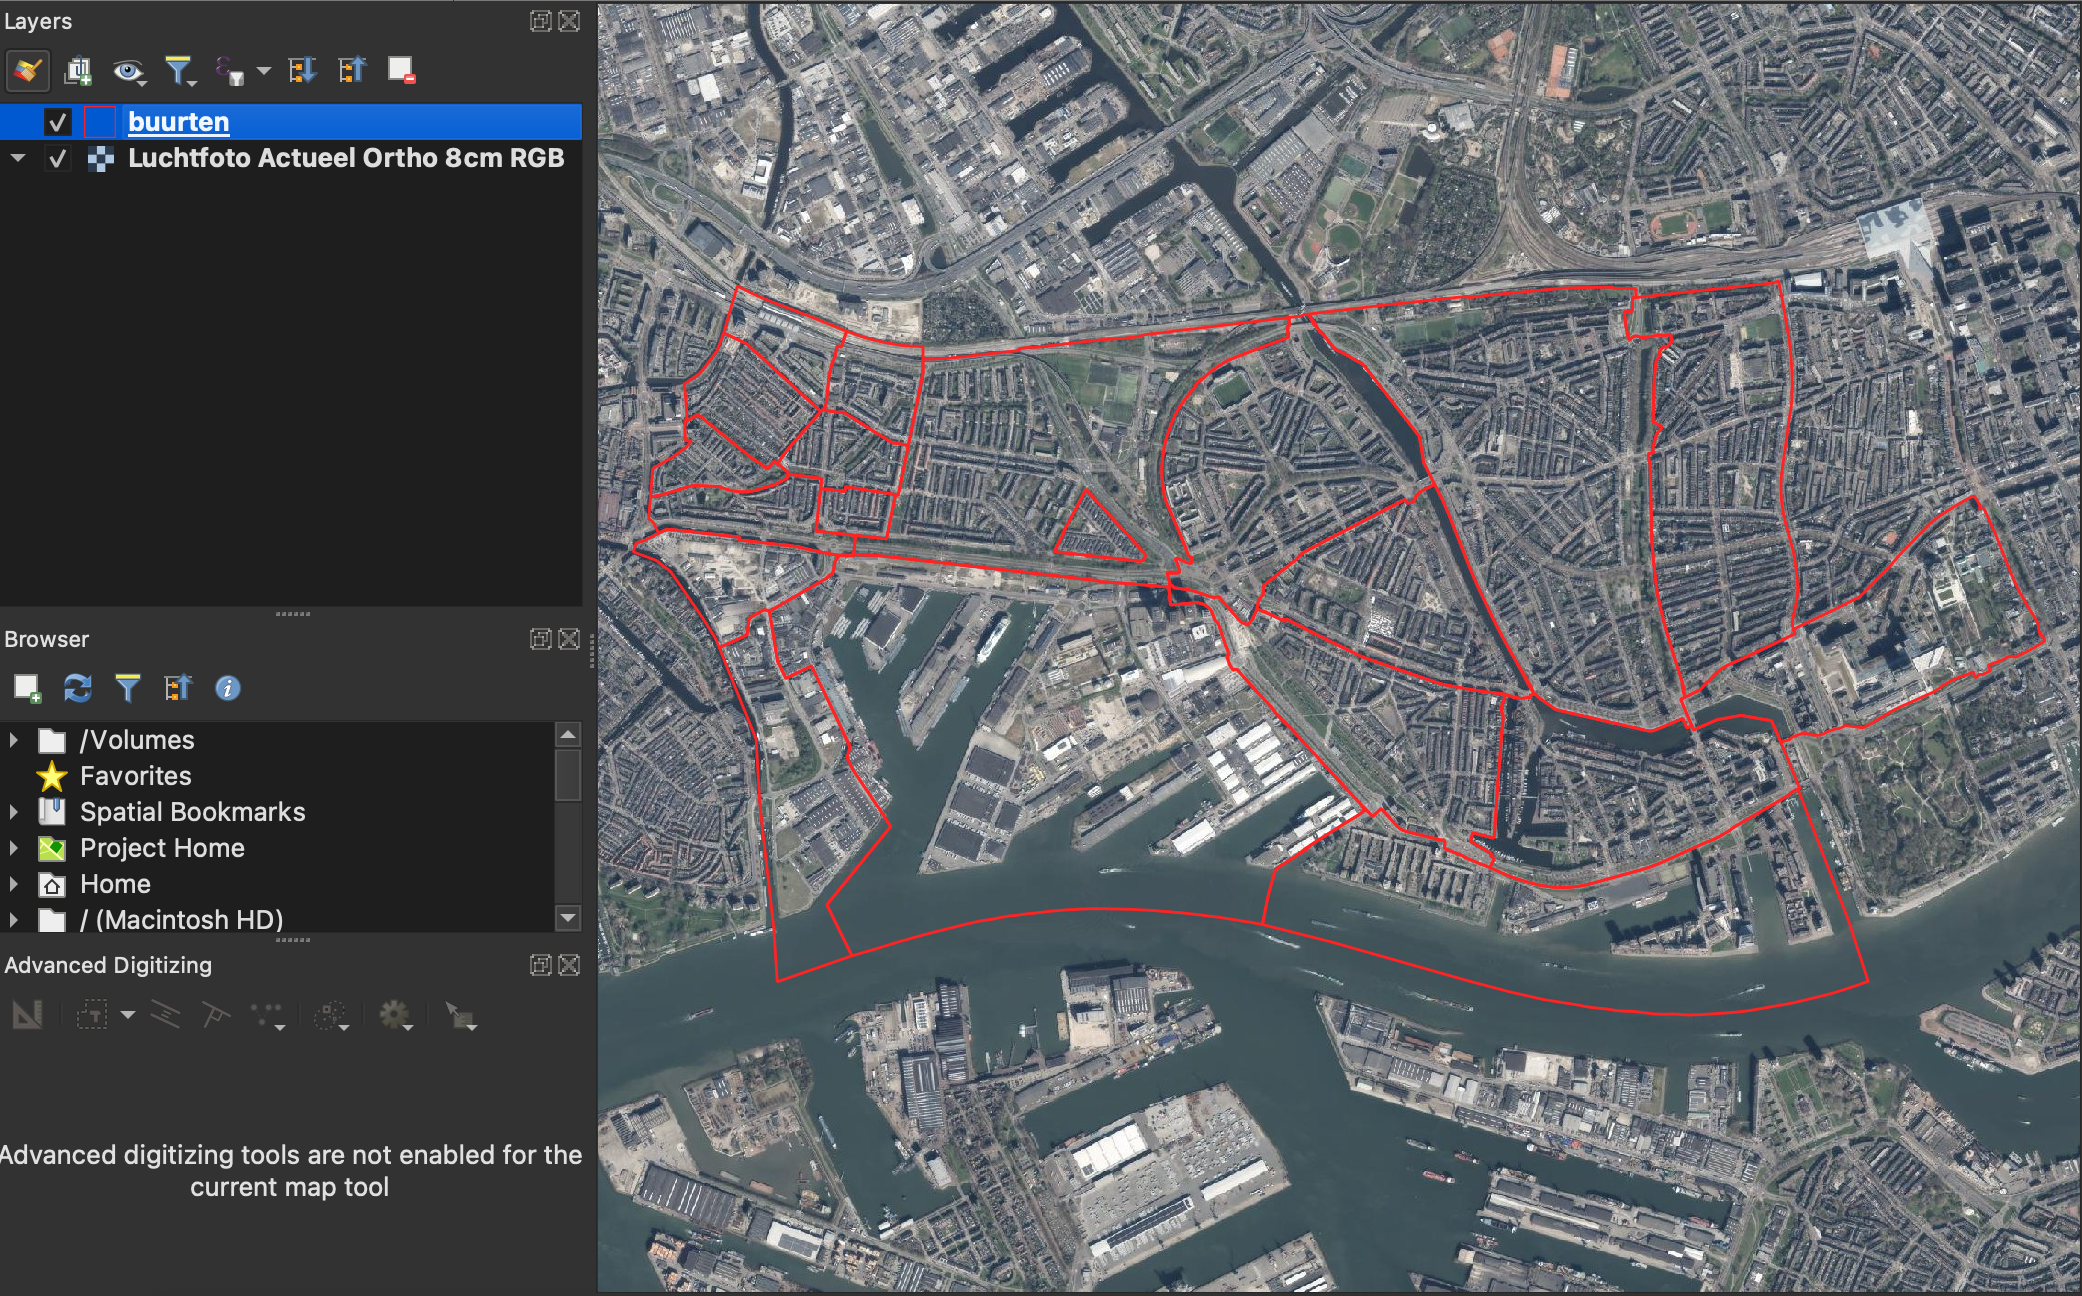
Figure 1 - Reference layers: boundaries and aerial photo - In the Layers panel, ensure the order is:
Part 3: Georeferencing with Freehand Raster Georeferencer
Import the map to be georeferenced:
- Locate the
Ruimte_voor_toekomstige_dijkversterking.jpgfile in your working folder - Do NOT add it as a regular raster layer (it has no coordinate information yet)
- Locate the
Launch the Freehand Raster Georeferencer:
- Go to
Raster>Freehand Raster Georeferencer>Freehand Raster Georeferencer - Or look for the plugin icon in the toolbar
- Go to
Add the raster for interactive georeferencing:
- In the Freehand Raster Georeferencer panel that appears, click
Add Raster - Navigate to and select
Ruimte_voor_toekomstige_dijkversterking.j``pg - The image will appear in the map canvas as a semi-transparent overlay
- It will initially appear at an arbitrary location
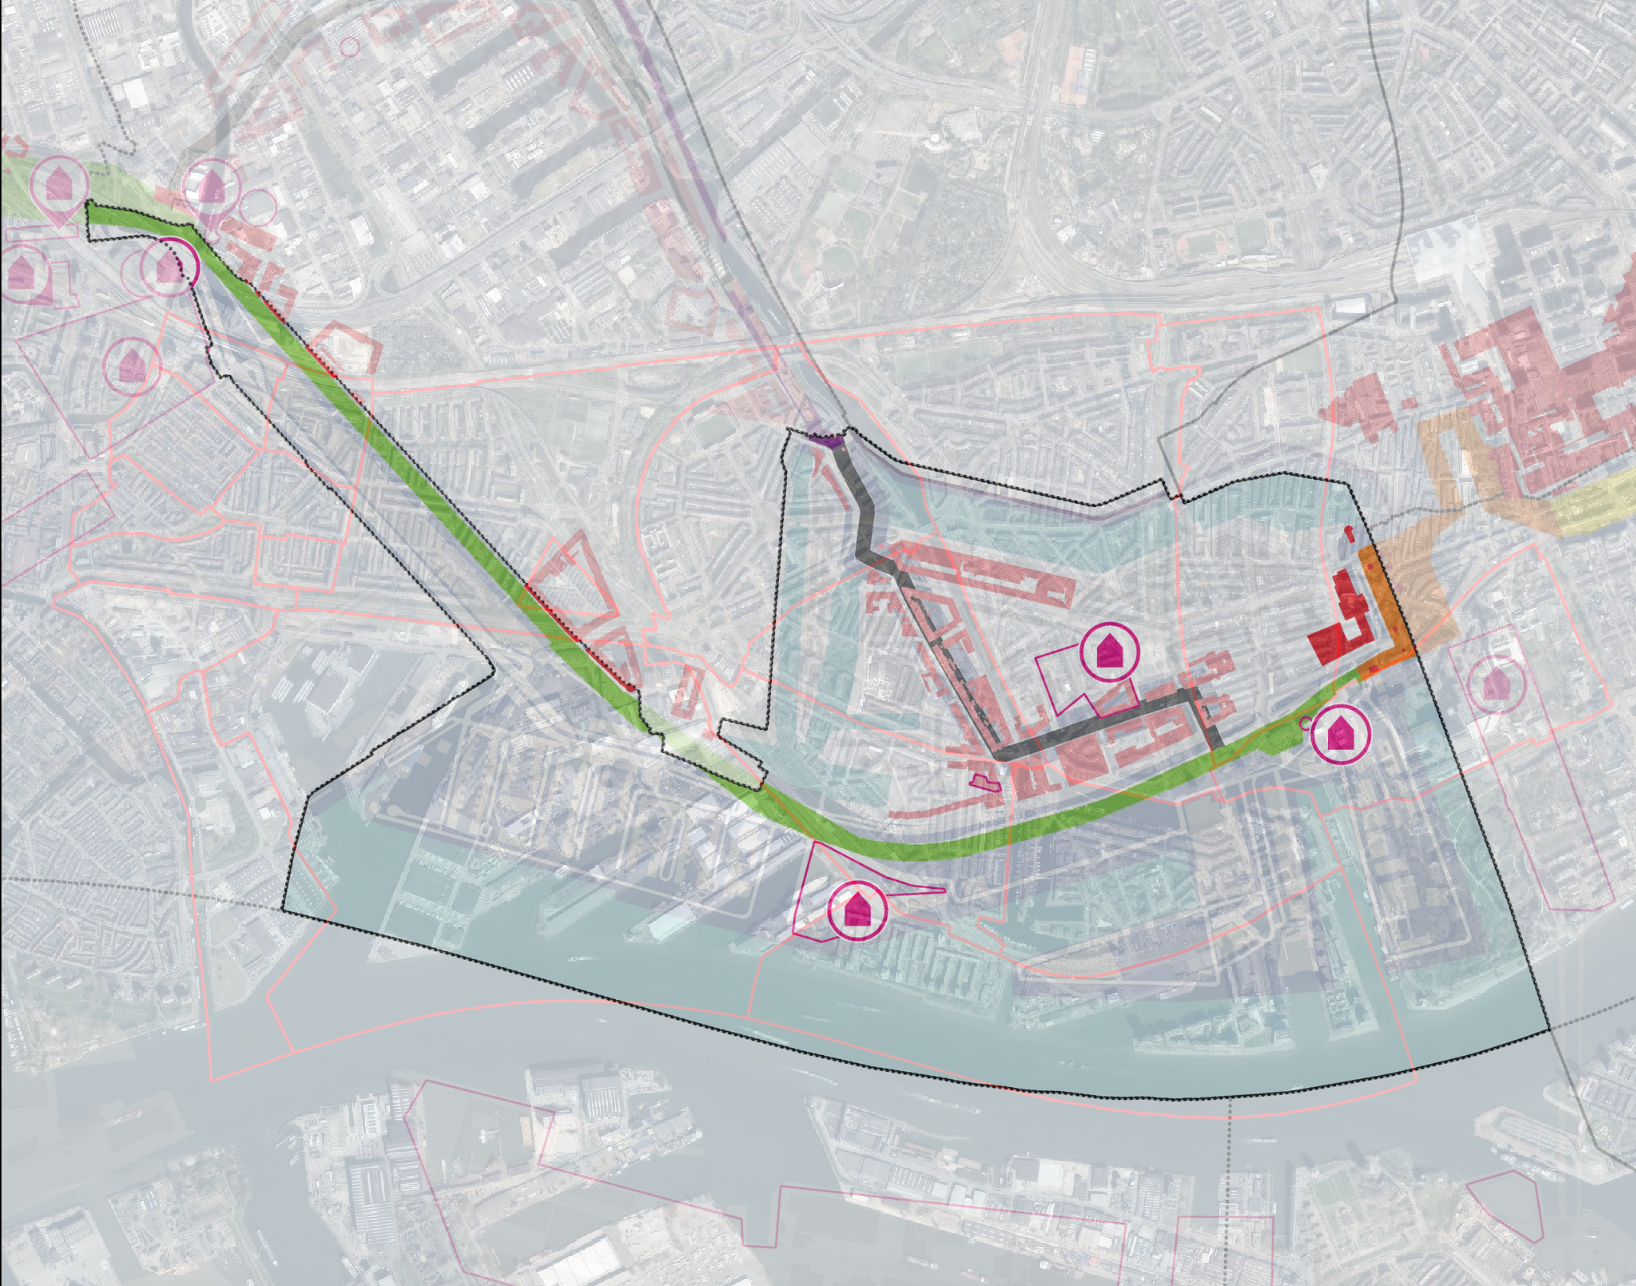
Figure 2 - Unreferenced map loaded in the canvas - In the Freehand Raster Georeferencer panel that appears, click
Interactively position and scale the map:
The plugin provides tools to manipulate the image directly in the map canvas:
Move: Click and drag the image to roughly position it over the corresponding area in your reference data
Rotate: Use the rotation handle (or tool) to align the image with the aerial photo
Scale: Use the corner handles to resize the image to match the scale of your reference data
NoteIt helps to zoom in to the extent that the raster must fit in to, saves some time
Tips for initial positioning:
- Look for distinctive features that appear in both the historical map and current aerial photo (buildings, streets, canals, landmarks)
- Start with rough positioning, then refine
- Use major roads or canals as alignment guides
- Adjust transparency if needed to see both layers clearly
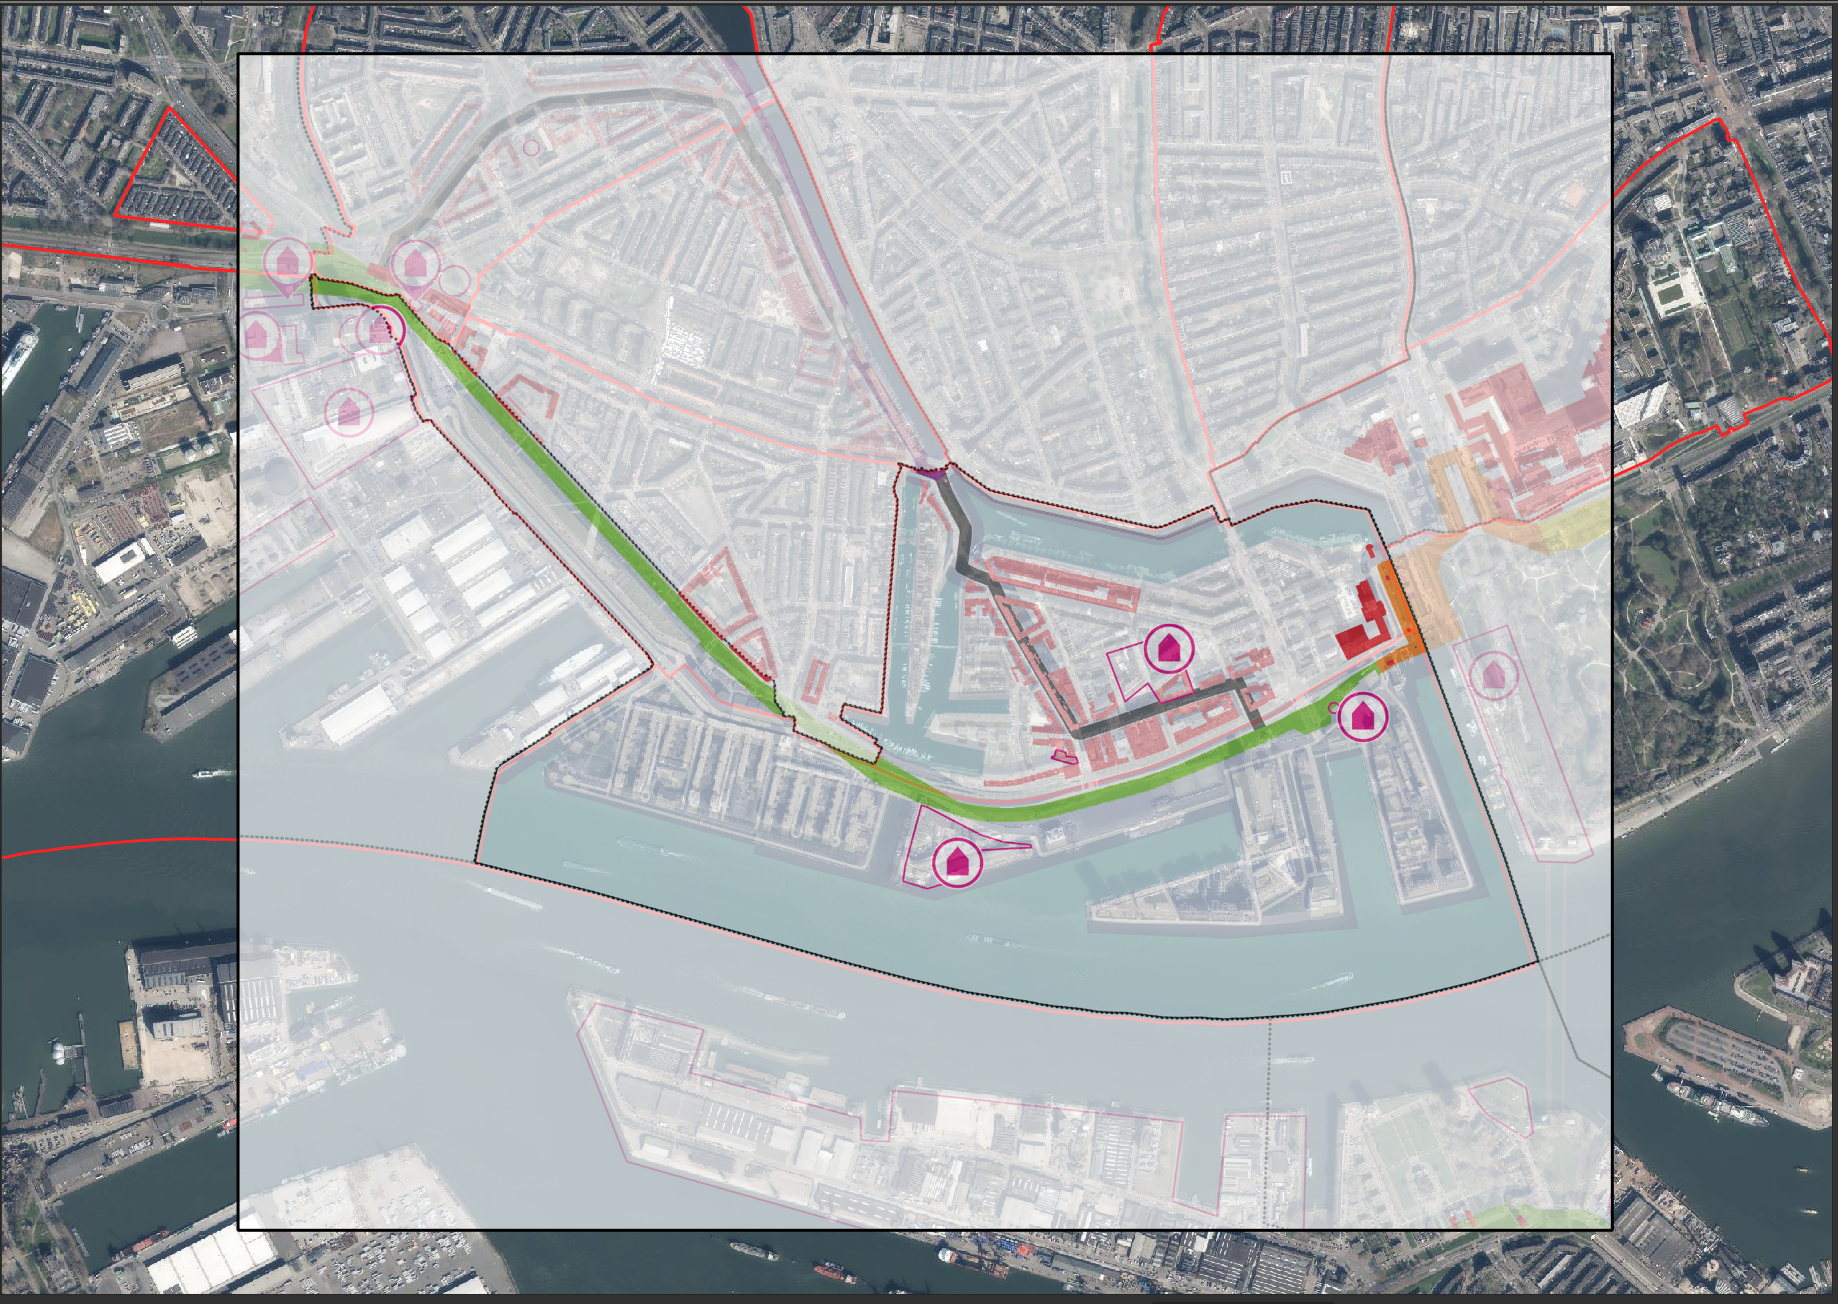
Figure 3 - Initial rough positioning of the map
Precise georeferencing with 2 control points: Once the image is roughly positioned, you need to use the “Georeference raster with 2 Points” tool for precise alignment. This tool allows you to combine move, rotate, and uniform scale to georeference using 2 points that are identified in both the background layers and the raster to georeference.
- Point 1: Moves the entire raster to align this point
- Point 2: Rotates and scales the raster around point 1 to align this second point This is sufficient for maps that don’t have complex distortions
Steps:
In the Freehand Raster Georeferencer toolbar, click the Georeference raster with 2 Points tool icon First point:
Click on a distinctive feature on your Ruimte_voor_toekomstige_dijkversterking.jpg image (e.g., a sharp building corner) Drag it to the exact same location on the reference data (aerial photo/map) The raster will move with your cursor, just like the Move tool The selected point will stay highlighted in red
Second point:
Click on another distinctive feature on your Ruimte_voor_toekomstige_dijkversterking.jpg image Drag it to the corresponding location on the reference data This time, the raster will rotate and scale instead of moving The image will adjust to align both points simultaneously
Best practices for selecting the 2 points:
Distribute points evenly - Choose points at opposite corners or edges of the image (not close together) Maximum distance - The farther apart your points are, the more accurate the rotation and scale Choose sharp, precise features: building corners, road intersections, bridge endpoints Avoid features that may have changed over time (temporary structures, vegetation) Use features that are clearly visible in both the historical map and current reference data
Good point locations:
✓ Building corners (if buildings still exist in the same location)
✓ Road intersections (especially T-junctions or crossroads)
✓ Bridge corners or endpoints
✓ Monument centers or distinctive landmarks
✓ Canal locks, church spires, or other permanent structures
✗ Trees or vegetation (changes over time)
✗ Shorelines (may have changed due to development)
✗ Vague or unclear features
✗ Features that are too close together
After applying the 2-point tool, toggle the georeferenced layer on/off Check alignment at different locations across the map If certain areas don’t align well:
You can repeat the 2-point process with different points Try selecting points in areas that previously didn’t align well For maps with complex distortions, you might need to use QGIS’s built-in Georeferencer tool with more points (see Extension Activities)
When 2 Points Isn’t Enough The 2-point method works well for:
Modern, accurately printed maps Maps without significant distortion Small-scale maps or portions of larger maps
If your map has:
Local distortions or warping Non-uniform scale across the image Poor printing quality with irregular stretching
Then consider using QGIS’s built-in Georeferencer tool which allows multiple control points and polynomial transformations.
Apply the georeferencing:
- Click the
Export Raster with world filebutton - Choose output settings:
- Output file: Save as
map_georeferenced.tifin your working folder
- Output file: Save as
- Click
OK - The georeferenced raster will be added to your map
- Click the
Verify the result:
Toggle the georeferenced layer on/off to compare with the aerial photo
Check different areas of the image, especially:
-   The corners and edges (farthest from your control points)

-   Major landmarks and intersections

-   The black boundary outline
Zoom to different scales to verify alignment accuracy
If alignment is poor in certain areas, note where the discrepancies occur
Quality check questions:
Do buildings align with their current locations?
Do roads and intersections match?
Are the colored protection zone outlines clearly visible?
Is the scale roughly correct across the entire map?

Figure 5 - Final georeferenced map overlay
Part 4: Digitizing Features from the Georeferenced Map
Now that your map is georeferenced, you can extract information by digitizing vector features.
Create a new vector layer for digitizing:
Example: Digitizing buildings
- Go to
Layer>Create Layer>New GeoPackage Layer... - Database: Click
...and save asdigitized_features.gpkg - Layer name:
housing_dev_protection_zone - Geometry type:
Polygon - CRS: EPSG:28992
Add attribute fields:
- Click
New Fieldto add attributes:- Name:
area_id| Type:Whole number(Integer) - Name:
area_type| Type:String| Length: 50 - Name:
notes| Type:String| Length: 100
- Name:
- Click
OKto create the layer
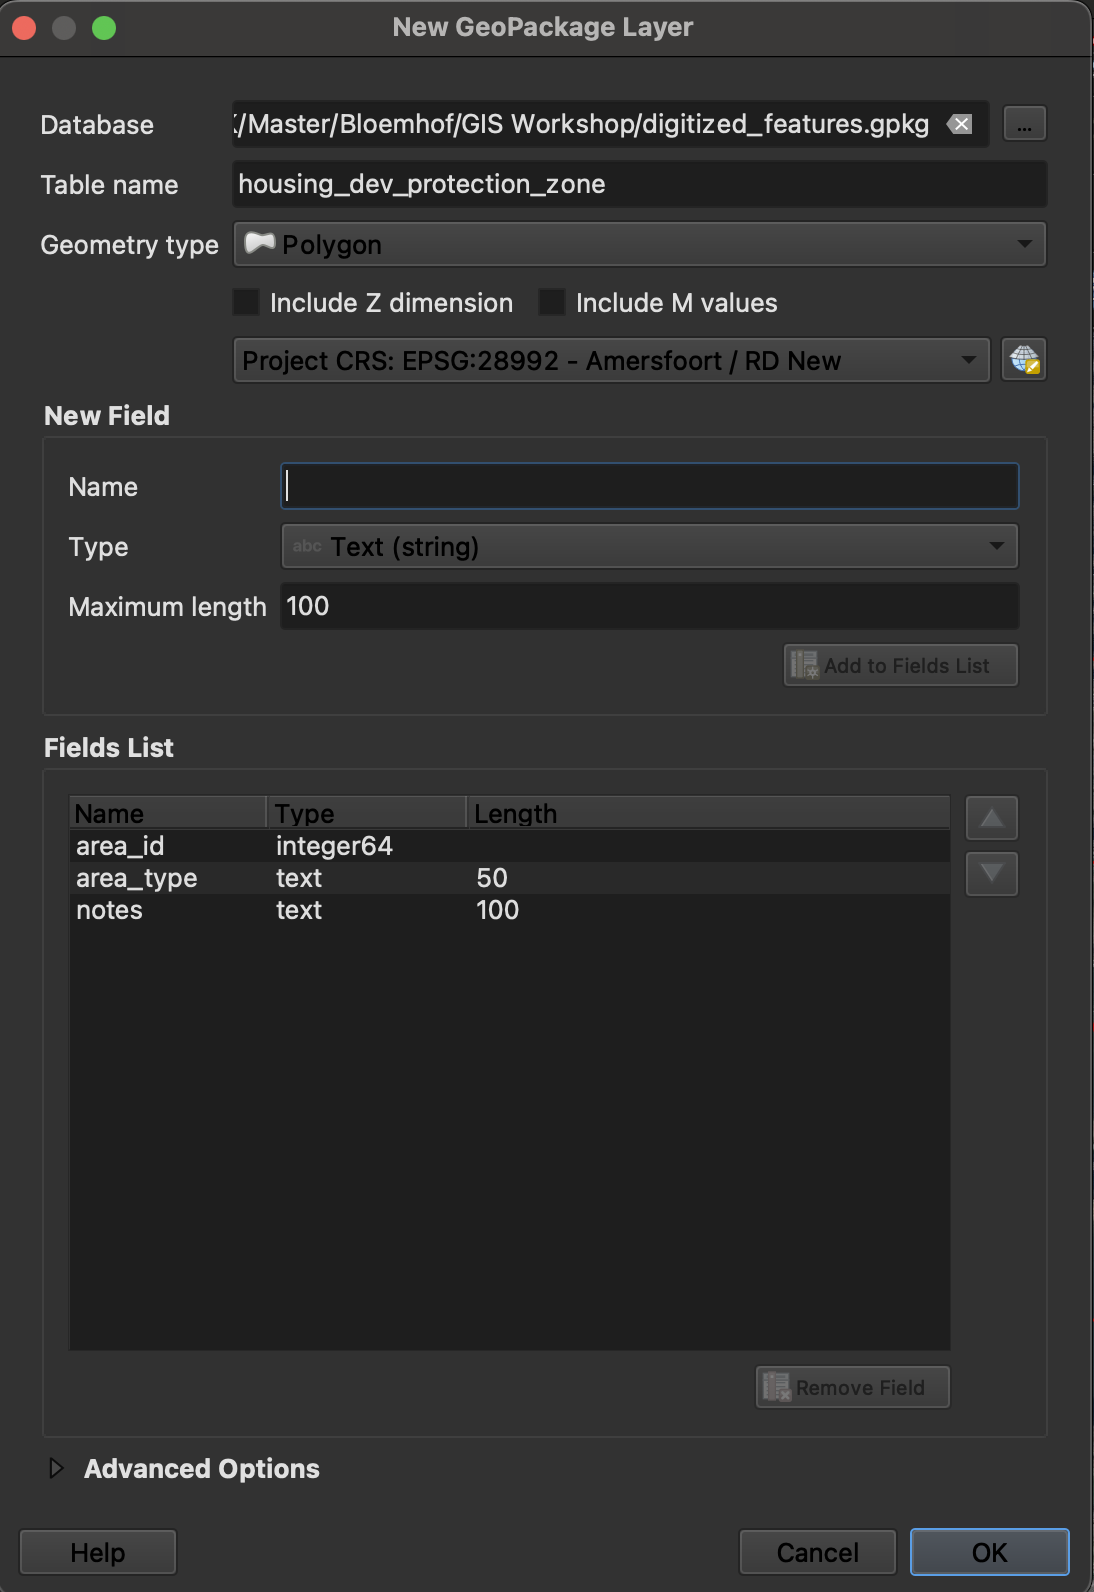
Figure 6 - Creating a new vector layer for digitizing - Go to
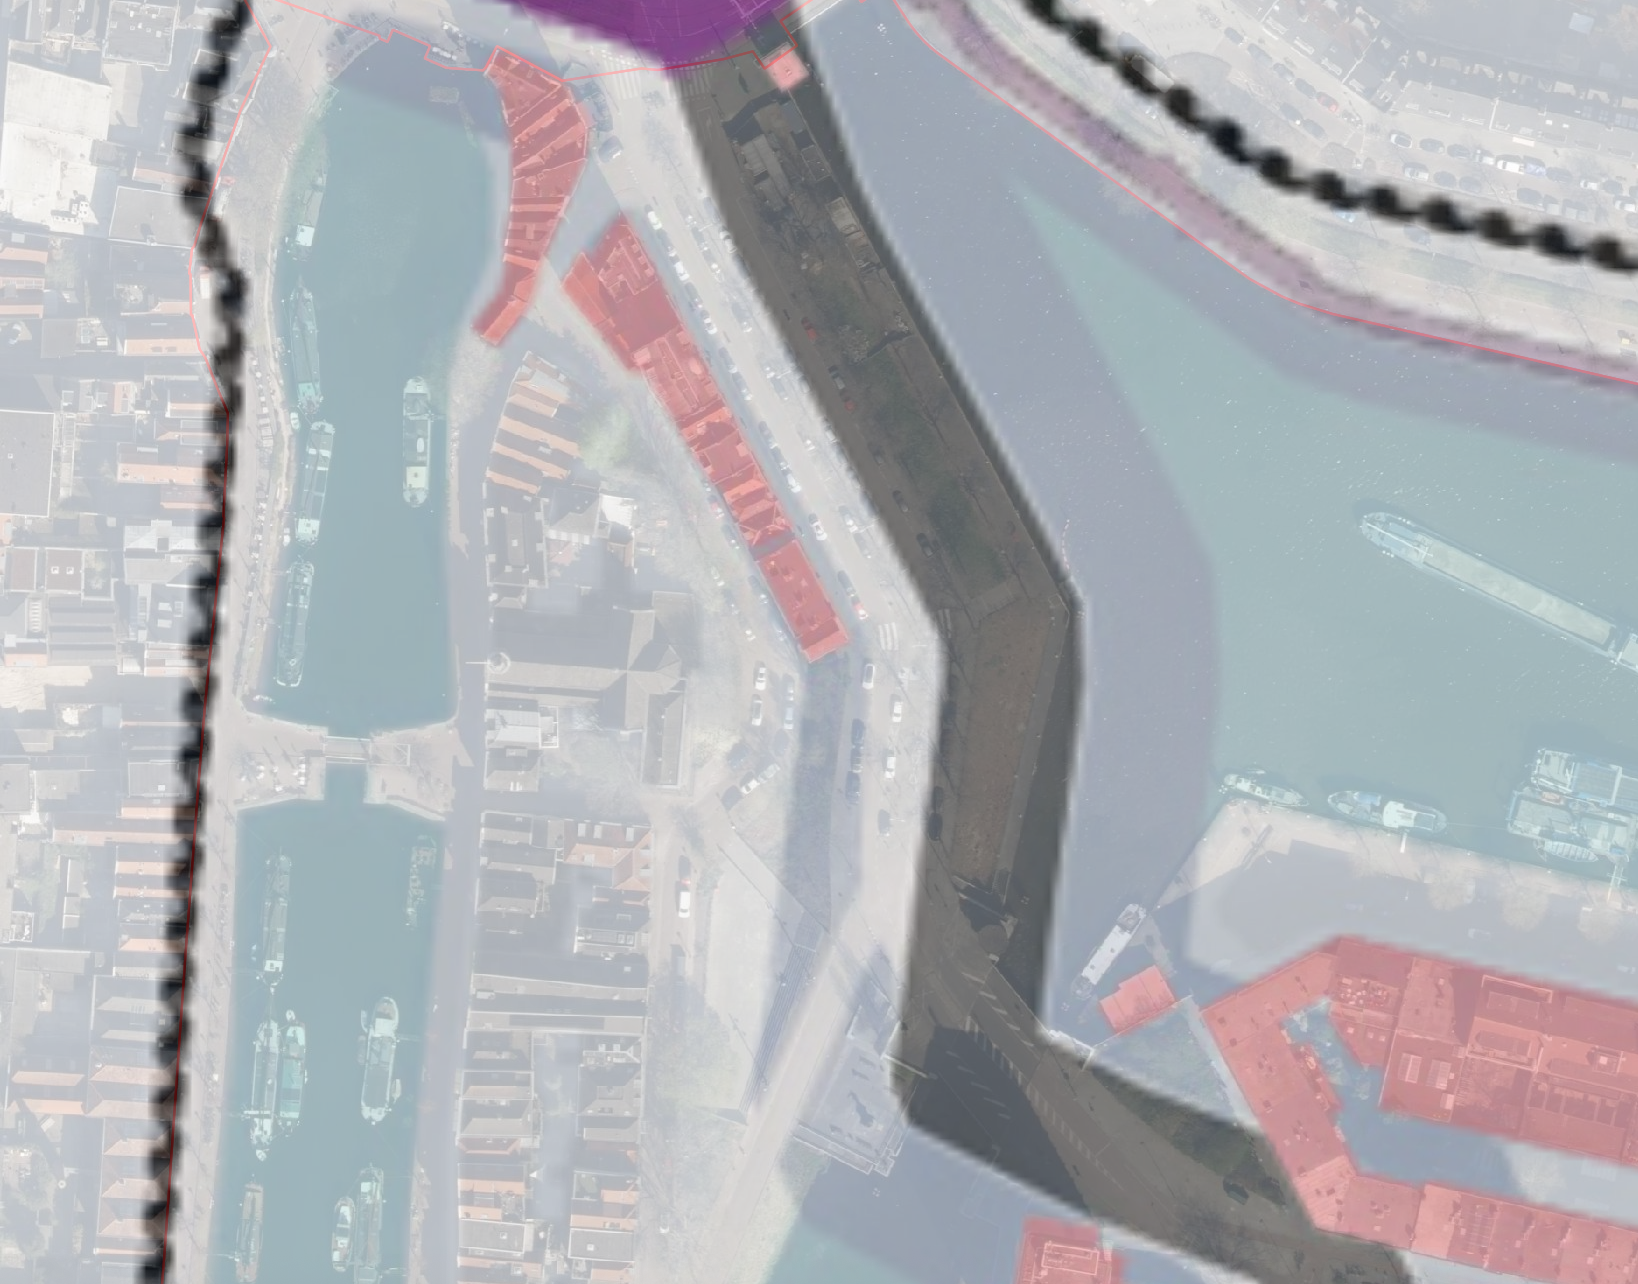
Identify the three perimeters to digitize:
The georeferenced map shows “Woningbouwontwikkelingen in beschermingszone: rekening houden met profiel waterkering” (Housing Development in Protection Zone: Taking into Account Water Defense Profile). Before you start digitizing, carefully examine the georeferenced map:
Zoom to the area within the thick black boundary
Look for the three polygons with the pink outline
Start digitizing:
- Select the
housing_dev_protection_zonelayer in the Layers panel - Click the
Toggle Editingbutton (pencil icon) or press Ctrl+E - Click the
Add Polygon Featurebutton (or press Ctrl+.)
Digitizing workflow:
- Left-click to place vertices around the building outline
- Right-click to finish the polygon
- Enter attribute values in the pop-up form:
area_id: 1, 2, 3, etc.area_type: e.g., “housing developmentnotes: any observations
- Click
OK
Digitizing tips:
- Zoom in close for precision
- Use the mouse wheel to zoom in/out while digitizing
- Press
Backspaceto remove the last vertex - Press
Escto cancel the current feature - Enable snapping (
Settings>Snapping Options) to connect features precisely
Figure 7 - Digitizing building polygons - Select the
Digitize multiple features:
- Digitize the 3 areas from your georeferenced map
- Make sure each feature has complete attributes
Edit existing features (if needed):
- With editing enabled, select the
Vertex Tool(or press V) - Click on a feature to see its vertices
- Click and drag vertices to adjust position
- Click between vertices to add new ones
- Click on a vertex and press
Deleteto remove it
- With editing enabled, select the
Save your edits:
- Click the
Save Layer Editsbutton (floppy disk icon) - Click
Toggle Editingagain to stop editing - Your digitized features are now permanently saved in the GeoPackage
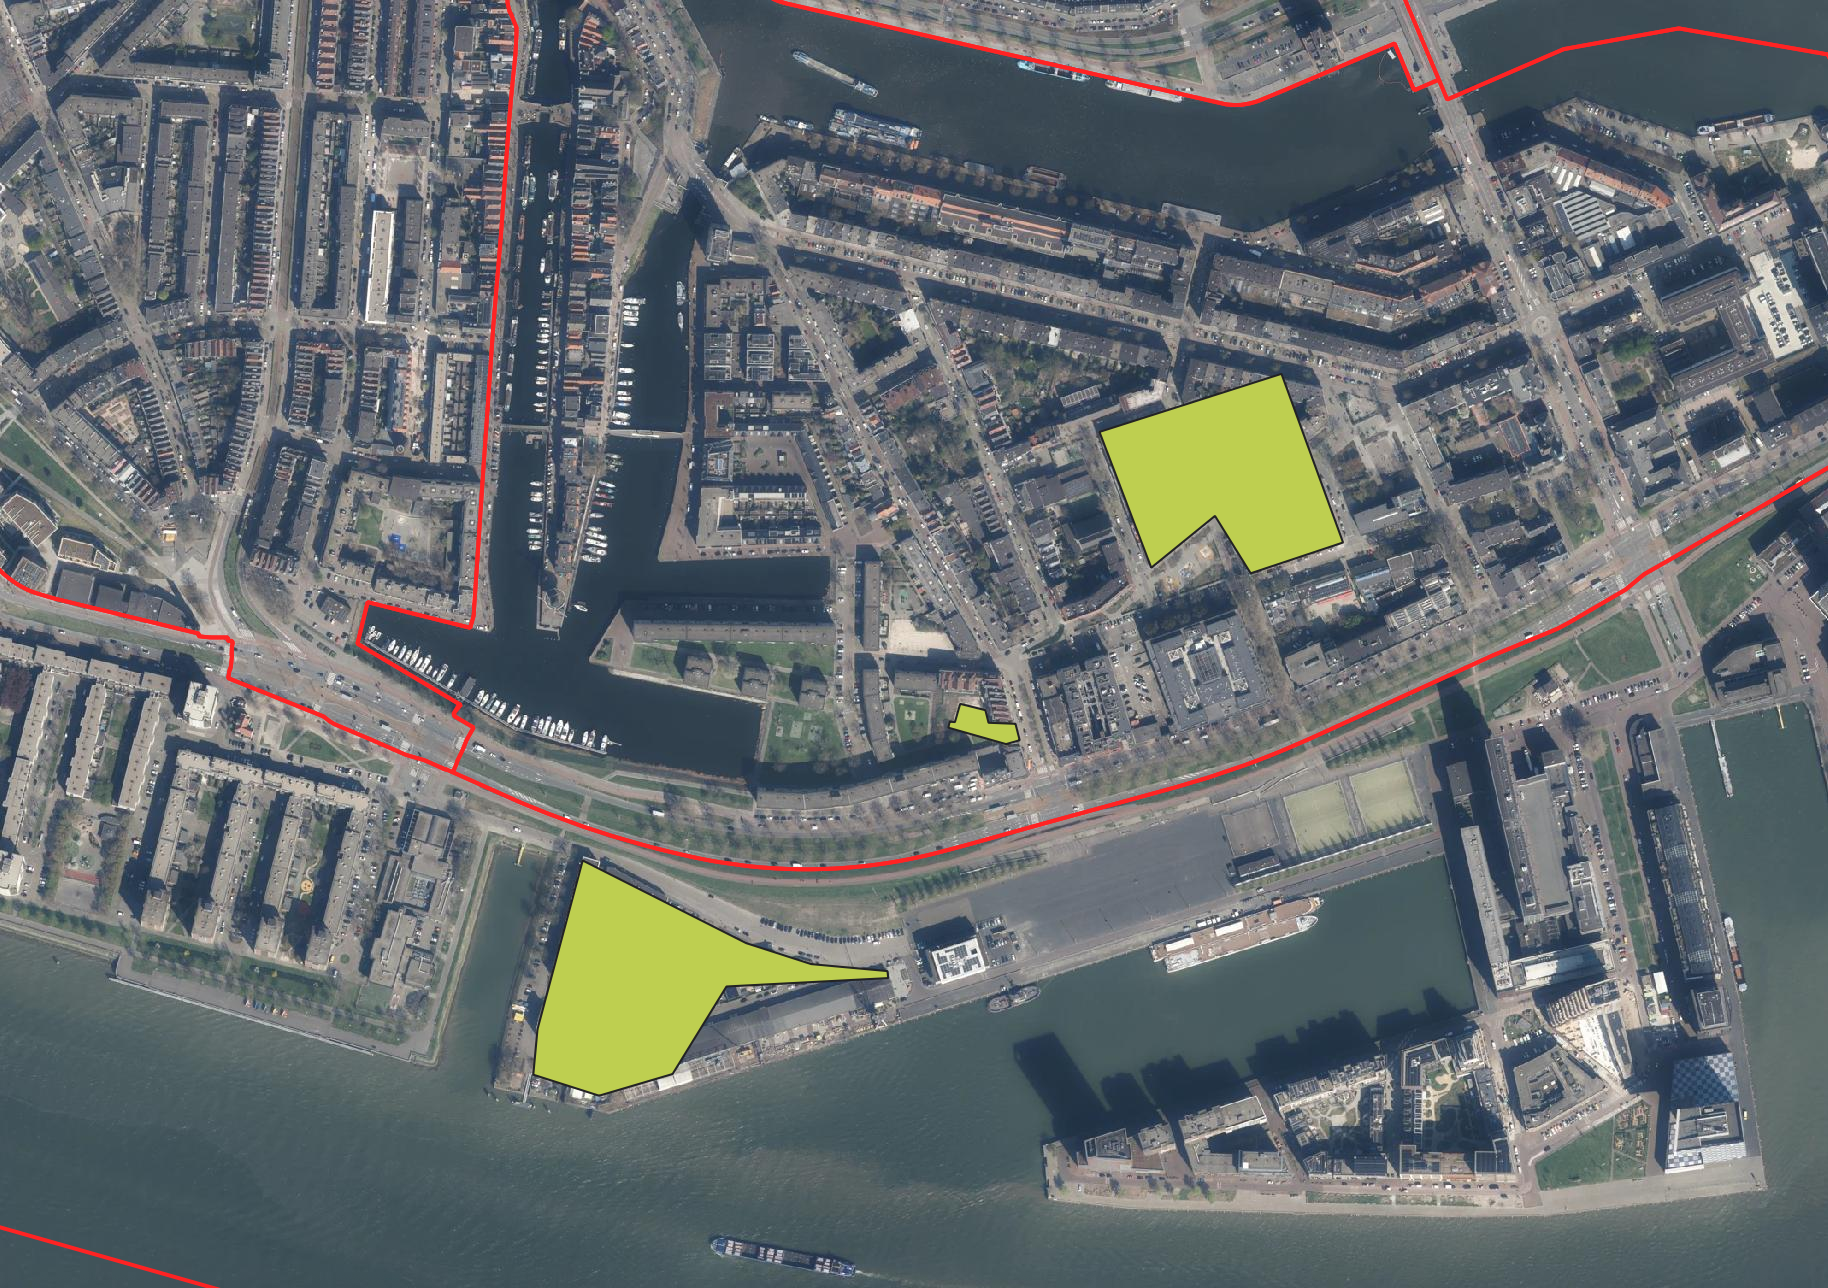
Figure 8 - Completed digitized buildings - Click the
Part 5: Analysis and Comparison (Optional)
Create additional layers:
You can create separate layers for different feature types:
- Lines: Roads, canals, railways
- Points: Trees, monuments, street furniture
- Polygons: Parks, building footprints, land use areas
Follow the same process as steps 16-20, adjusting the geometry type as needed.
Recap
What you’ve learned:
- How to install and use the Freehand Raster Georeferencer plugin for interactive georeferencing
- The concept of Ground Control Points (GCPs) and how to place them effectively
- Different transformation types and when to use them
- Creating new vector layers with custom attributes
- Digitizing techniques for points, lines, and polygons
- Using the vertex tool to edit geometries
Key concepts:
| Concept | Description |
|---|---|
| Georeferencing | Assigning real-world coordinates to an image |
| GCP | Ground Control Point - a known location used for georeferencing |
| Residual error | The difference between predicted and actual GCP locations |
| Digitizing | Creating vector features by tracing from a raster image |
| Snapping | Automatic alignment of vertices to other features |
| Topology | Spatial relationships between features |
Best practices for georeferencing:
- Choose permanent, precise features (building corners, intersections)
- Check residual errors and remove/adjust problematic points
- Save your GCP points for future reference or refinement
- Use appropriate transformation type for your data
- Always verify the result by toggling layers and checking alignment
Best practices for digitizing:
- Zoom in close for precision
- Enable snapping to connect features properly
- Use consistent attribution for all features
- Save frequently during editing
- Follow topology rules (e.g., no gaps, no overlaps for land parcels)
- Document your methodology and any uncertainties
Common Issues and Solutions
Cause: Local distortions in the original map (common in historical maps)
Solution: Use Thin Plate Spline (TPS) transformation with 15+ GCPs, or georeference the image in sections.
Cause: GCP placed incorrectly, or the feature has actually moved/changed
Solution: Review the point placement. If correct, the feature may have genuinely changed position - this is valuable historical information!
Extension Activities
- Georeference multiple historical maps from different time periods and compare changes
- Calculate the area of buildings that have been demolished or added
- Create a time-series animation showing urban development
- Use the Georeferencer tool (built into QGIS) instead of the plugin to compare workflows
- Digitize a complete street network and perform network analysis
- Research historical sources to add rich attribute data to your digitized features
- Create a web map showing historical vs. current imagery side-by-side
Resources
- QGIS Georeferencing documentation: https://docs.qgis.org/latest/en/docs/user_manual/working_with_raster/georeferencer.html
- Digitizing documentation: https://docs.qgis.org/latest/en/docs/user_manual/working_with_vector/editing_geometry_attributes.html